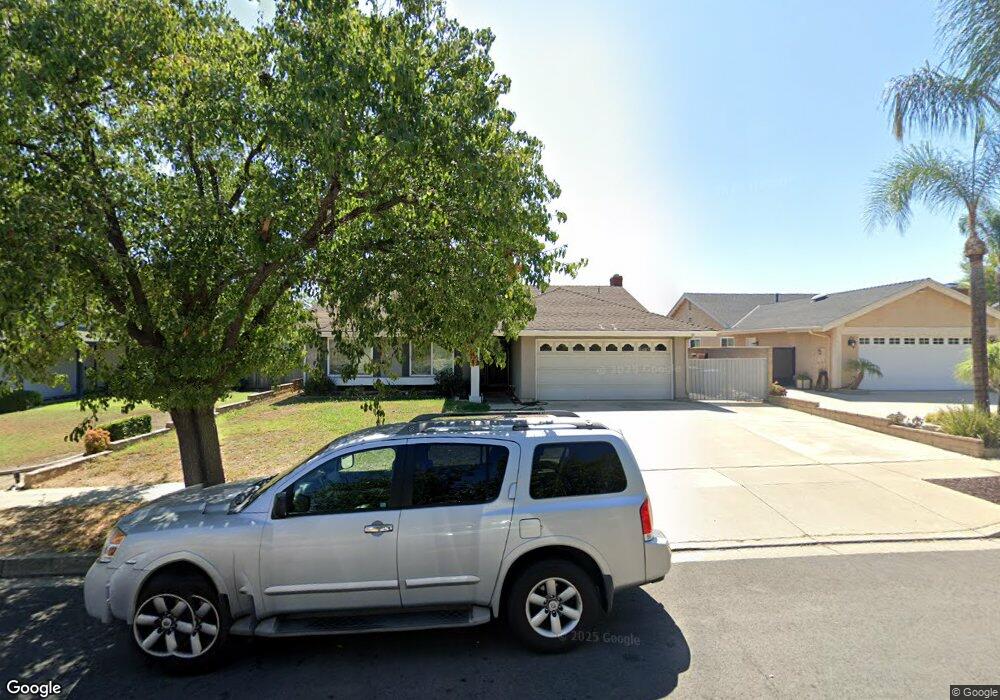
10199 Bristol Dr Rancho Cucamonga, CA 91737
Estimated Value: $726,000 - $891,000
3
Beds
2
Baths
1,466
Sq Ft
$536/Sq Ft
Est. Value
About This Home
This home is located at 10199 Bristol Dr, Rancho Cucamonga, CA 91737 and is currently estimated at $786,294, approximately $536 per square foot. 10199 Bristol Dr is a home located in San Bernardino County with nearby schools including Deer Canyon Elementary, Vineyard Junior High, and Los Osos High.
Ownership History
Date
Name
Owned For
Owner Type
Purchase Details
Closed on
Feb 23, 2009
Sold by
Martinez Mark
Bought by
Lau Melissa and Lau Steven
Current Estimated Value
Home Financials for this Owner
Home Financials are based on the most recent Mortgage that was taken out on this home.
Original Mortgage
$309,294
Outstanding Balance
$194,364
Interest Rate
4.91%
Mortgage Type
FHA
Estimated Equity
$591,930
Purchase Details
Closed on
Sep 9, 2002
Sold by
Martinez Diane A
Bought by
Martinez Mark and Martinez Diane A
Home Financials for this Owner
Home Financials are based on the most recent Mortgage that was taken out on this home.
Original Mortgage
$184,000
Interest Rate
7.25%
Purchase Details
Closed on
Sep 25, 1998
Sold by
Martinez Diane A and Roberts Diane
Bought by
Martinez Mark and Martinez Diane A
Purchase Details
Closed on
May 24, 1995
Sold by
Roberts Richard
Bought by
Roberts Diane
Create a Home Valuation Report for This Property
The Home Valuation Report is an in-depth analysis detailing your home's value as well as a comparison with similar homes in the area
Home Values in the Area
Average Home Value in this Area
Purchase History
| Date | Buyer | Sale Price | Title Company |
|---|---|---|---|
| Lau Melissa | $315,000 | Landsafe Title | |
| Martinez Mark | -- | Stewart Title Company | |
| Martinez Diane A | -- | Stewart Title Company | |
| Martinez Mark | -- | Fidelity National Title | |
| Roberts Diane | -- | -- |
Source: Public Records
Mortgage History
| Date | Status | Borrower | Loan Amount |
|---|---|---|---|
| Open | Lau Melissa | $309,294 | |
| Previous Owner | Martinez Diane A | $184,000 |
Source: Public Records
Tax History Compared to Growth
Tax History
| Year | Tax Paid | Tax Assessment Tax Assessment Total Assessment is a certain percentage of the fair market value that is determined by local assessors to be the total taxable value of land and additions on the property. | Land | Improvement |
|---|---|---|---|---|
| 2025 | $4,404 | $405,646 | $141,654 | $263,992 |
| 2024 | $4,404 | $397,692 | $138,876 | $258,816 |
| 2023 | $4,305 | $389,894 | $136,153 | $253,741 |
| 2022 | $4,294 | $382,249 | $133,483 | $248,766 |
| 2021 | $4,293 | $374,754 | $130,866 | $243,888 |
| 2020 | $4,116 | $370,911 | $129,524 | $241,387 |
| 2019 | $4,164 | $363,638 | $126,984 | $236,654 |
| 2018 | $4,070 | $356,508 | $124,494 | $232,014 |
| 2017 | $3,885 | $349,518 | $122,053 | $227,465 |
| 2016 | $3,780 | $342,665 | $119,660 | $223,005 |
| 2015 | $3,756 | $337,518 | $117,863 | $219,655 |
| 2014 | $3,650 | $330,906 | $115,554 | $215,352 |
Source: Public Records
Map
Nearby Homes
- 10141 Orange St
- 6281 Kinlock Ave
- 10123 Finch Ave
- 6210 Halstead Ave
- 6600 Montresor Place
- 6162 Mayberry Ave
- 10121 Banyan St
- 6644 Brissac Place
- 10393 Cartilla Ct
- 6360 Calle Hermoso
- 10414 Hamilton St
- 10456 Hamilton St
- 9757 Balaton St
- 10655 Lemon Ave Unit 2402
- 10655 Lemon Ave Unit 2703
- 10655 Lemon Ave Unit 2605
- 10655 Lemon Ave Unit 1710
- 10655 Lemon Ave Unit 4004
- 10655 Lemon Ave Unit 1508
- 10655 Lemon Ave Unit 4009
- 10207 Bristol Dr
- 10191 Bristol Dr
- 10217 Bristol Dr
- 10181 Bristol Dr
- 6367 Malvern St
- 6366 Kinlock St
- 10227 Bristol Dr
- 10171 Bristol Dr
- 6355 Malvern St
- 6356 Kinlock St
- 10237 Bristol Dr
- 10163 Bristol Dr
- 10168 Bristol Dr
- 6367 Kinlock St
- 10241 Bristol Dr
- 10153 Bristol Dr
- 6344 Kinlock St
- 6345 Malvern St
- 10160 Bristol Dr
- 6357 Kinlock St