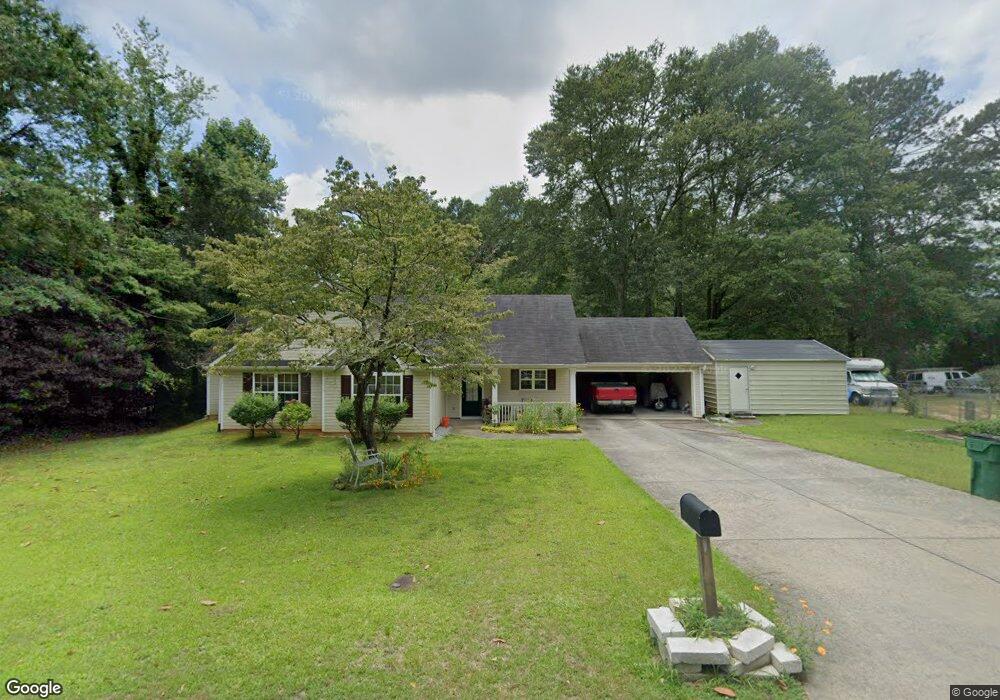
102 Alexander St Winder, GA 30680
Estimated Value: $318,000 - $349,000
3
Beds
2
Baths
1,625
Sq Ft
$204/Sq Ft
Est. Value
About This Home
This home is located at 102 Alexander St, Winder, GA 30680 and is currently estimated at $331,297, approximately $203 per square foot. 102 Alexander St is a home located in Barrow County with nearby schools including County Line Elementary School, Russell Middle School, and Winder-Barrow High School.
Ownership History
Date
Name
Owned For
Owner Type
Purchase Details
Closed on
Feb 22, 2013
Sold by
Hopkins Wayne D
Bought by
Hopkins Wayne D and Allegro Bianca M
Current Estimated Value
Home Financials for this Owner
Home Financials are based on the most recent Mortgage that was taken out on this home.
Original Mortgage
$132,605
Outstanding Balance
$93,083
Interest Rate
3.5%
Mortgage Type
FHA
Estimated Equity
$238,214
Purchase Details
Closed on
Dec 30, 2008
Sold by
Pac Homes Llc
Bought by
Hopkins Wayne D
Home Financials for this Owner
Home Financials are based on the most recent Mortgage that was taken out on this home.
Original Mortgage
$141,137
Interest Rate
5.96%
Mortgage Type
FHA
Purchase Details
Closed on
Jul 10, 2006
Sold by
Adamson & Perkins Appraisal Se
Bought by
Pac Homes Llc
Purchase Details
Closed on
Apr 28, 2006
Sold by
Huston Mary E
Bought by
Adamson & Perkins Appraisal Service Inc
Create a Home Valuation Report for This Property
The Home Valuation Report is an in-depth analysis detailing your home's value as well as a comparison with similar homes in the area
Home Values in the Area
Average Home Value in this Area
Purchase History
| Date | Buyer | Sale Price | Title Company |
|---|---|---|---|
| Hopkins Wayne D | -- | -- | |
| Hopkins Wayne D | $143,500 | -- | |
| Pac Homes Llc | $38,000 | -- | |
| Adamson & Perkins Appraisal Service Inc | $36,500 | -- |
Source: Public Records
Mortgage History
| Date | Status | Borrower | Loan Amount |
|---|---|---|---|
| Open | Hopkins Wayne D | $132,605 | |
| Previous Owner | Hopkins Wayne D | $141,137 |
Source: Public Records
Tax History Compared to Growth
Tax History
| Year | Tax Paid | Tax Assessment Tax Assessment Total Assessment is a certain percentage of the fair market value that is determined by local assessors to be the total taxable value of land and additions on the property. | Land | Improvement |
|---|---|---|---|---|
| 2024 | $2,858 | $100,919 | $13,600 | $87,319 |
| 2023 | $2,849 | $100,919 | $13,600 | $87,319 |
| 2022 | $2,722 | $79,774 | $13,600 | $66,174 |
| 2021 | $2,392 | $65,430 | $13,600 | $51,830 |
| 2020 | $2,209 | $63,381 | $13,600 | $49,781 |
| 2019 | $1,925 | $53,876 | $13,600 | $40,276 |
| 2018 | $1,921 | $53,876 | $13,600 | $40,276 |
| 2017 | $1,325 | $44,412 | $13,600 | $30,812 |
| 2016 | $1,528 | $44,744 | $13,600 | $31,144 |
| 2015 | $1,541 | $45,076 | $13,600 | $31,476 |
| 2014 | $1,356 | $39,256 | $7,448 | $31,808 |
| 2013 | -- | $37,688 | $7,448 | $30,240 |
Source: Public Records
Map
Nearby Homes
- 352 3rd Ave
- 311 2nd Ave
- 256 4th Ave
- 303 Rocky Point Ct
- 0 Jerome St Unit 7439149
- 0 Jerome St Unit 10359679
- 17 W Wright St
- 0 W Williams St Unit 10464682
- 808 Lakeshore Dr
- 131 Pinehurst Dr
- 102 N Center St
- 18 E New St
- 116 N Broad St
- 92 Woodlawn Ave
- 15 E New St
- 217 Bellview St
- 197 Buena Vista St
- 273 Nancy St
- 326 Miles Patrick Rd
- 317 Georgia Ave