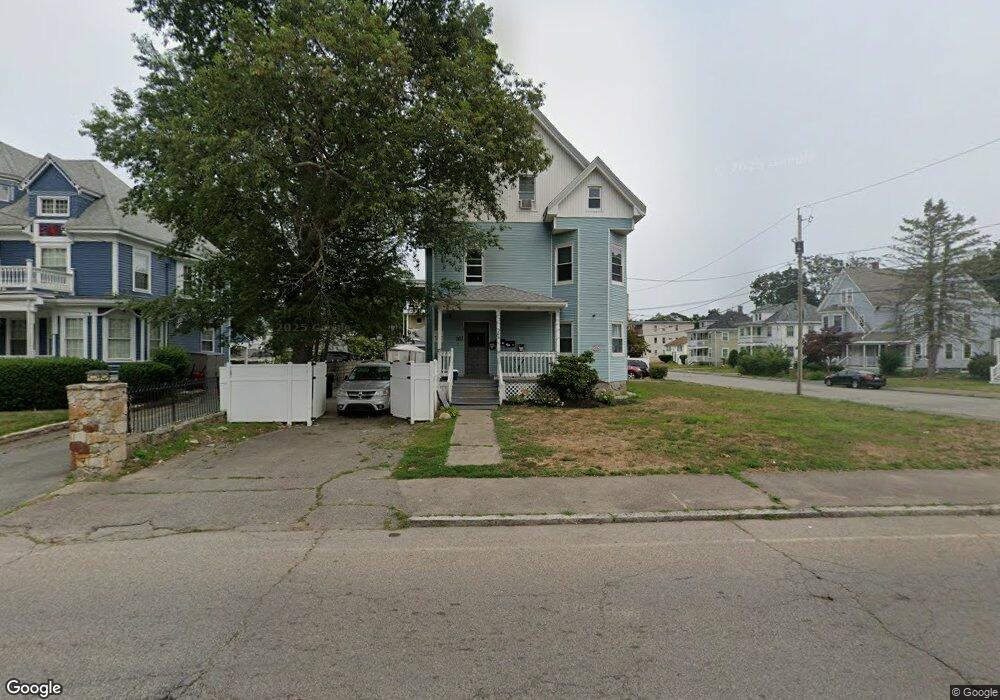
102 Ash St Brockton, MA 02301
Estimated Value: $741,000 - $1,021,000
11
Beds
3
Baths
3,671
Sq Ft
$231/Sq Ft
Est. Value
About This Home
This home is located at 102 Ash St, Brockton, MA 02301 and is currently estimated at $847,385, approximately $230 per square foot. 102 Ash St is a home located in Plymouth County with nearby schools including Manthala George Jr. School, Louis F Angelo Elementary School, and Raymond K-8 Elementary School.
Ownership History
Date
Name
Owned For
Owner Type
Purchase Details
Closed on
Jan 23, 2015
Sold by
102 Ash Street Rt
Bought by
Darosa Maria A
Current Estimated Value
Home Financials for this Owner
Home Financials are based on the most recent Mortgage that was taken out on this home.
Original Mortgage
$368,207
Outstanding Balance
$284,111
Interest Rate
4.12%
Mortgage Type
FHA
Estimated Equity
$563,274
Purchase Details
Closed on
Apr 1, 1996
Sold by
Crescent Cu
Bought by
Moore Jonathan C and Savage Peter A
Home Financials for this Owner
Home Financials are based on the most recent Mortgage that was taken out on this home.
Original Mortgage
$60,000
Interest Rate
6.9%
Mortgage Type
Purchase Money Mortgage
Purchase Details
Closed on
Dec 11, 1995
Sold by
Volpe Oreste B
Bought by
Crescent Cu
Create a Home Valuation Report for This Property
The Home Valuation Report is an in-depth analysis detailing your home's value as well as a comparison with similar homes in the area
Purchase History
| Date | Buyer | Sale Price | Title Company |
|---|---|---|---|
| Darosa Maria A | $375,000 | -- | |
| Moore Jonathan C | $75,000 | -- | |
| Crescent Cu | $128,000 | -- |
Source: Public Records
Mortgage History
| Date | Status | Borrower | Loan Amount |
|---|---|---|---|
| Open | Darosa Maria A | $368,207 | |
| Previous Owner | Crescent Cu | $104,300 | |
| Previous Owner | Crescent Cu | $60,000 | |
| Previous Owner | Crescent Cu | $31,650 |
Source: Public Records
Tax History
| Year | Tax Paid | Tax Assessment Tax Assessment Total Assessment is a certain percentage of the fair market value that is determined by local assessors to be the total taxable value of land and additions on the property. | Land | Improvement |
|---|---|---|---|---|
| 2025 | $9,860 | $814,200 | $140,400 | $673,800 |
| 2024 | $9,385 | $780,800 | $140,400 | $640,400 |
| 2023 | $9,840 | $758,100 | $105,900 | $652,200 |
| 2022 | $9,494 | $679,600 | $96,300 | $583,300 |
| 2021 | $8,752 | $603,600 | $80,300 | $523,300 |
| 2020 | $7,190 | $474,600 | $74,900 | $399,700 |
| 2019 | $6,981 | $449,200 | $73,000 | $376,200 |
| 2018 | $6,194 | $385,700 | $73,000 | $312,700 |
| 2017 | $5,976 | $371,200 | $73,000 | $298,200 |
| 2016 | $5,387 | $310,300 | $70,800 | $239,500 |
| 2015 | $4,145 | $228,400 | $70,800 | $157,600 |
| 2014 | $3,798 | $209,500 | $70,800 | $138,700 |
Source: Public Records
Map
Nearby Homes
- 4 Park Rd
- 72 W Elm Terrace
- 21 Simmons Ave
- 29 Auna Dr Unit 3
- 11 Auna Dr Unit 10
- 11 Auna Dr Unit 6
- 48 Simmons Ave
- 47 N Belcher Ave
- 7 N Winnifred Rd
- 226 W Elm St
- 35 Brett St
- 60 Elm Ave
- 35 Colonel Bell Dr Unit 35
- 75 Thurber Ave
- 66 Cross Ave
- 282 Belmont St
- 9 Grafton St
- 75 Colonel Bell Dr Unit 77-11
- 56 N Warren Ave
- 50 Manomet St
- 102 Ash St Unit 3
- 102 Ash St Unit 2
- 102 Ash St Unit 1
- 98 Ash St
- 369 Spring St
- 365 Spring St
- 376 Spring St
- 380 Spring St
- 40 Sycamore Ave
- 391 Spring St
- 32 Sycamore Ave
- 370 Spring St
- 101 Ash St
- 99 Ash St
- 388 Spring St Unit 3
- 361 Spring St
- 361 Spring St Unit 1
- 361 Spring St Unit 2
- 386 Spring St
- 28 Sycamore Ave
Your Personal Tour Guide
Ask me questions while you tour the home.