Estimated Value: $199,882 - $249,000
--
Bed
1
Bath
1,697
Sq Ft
$132/Sq Ft
Est. Value
About This Home
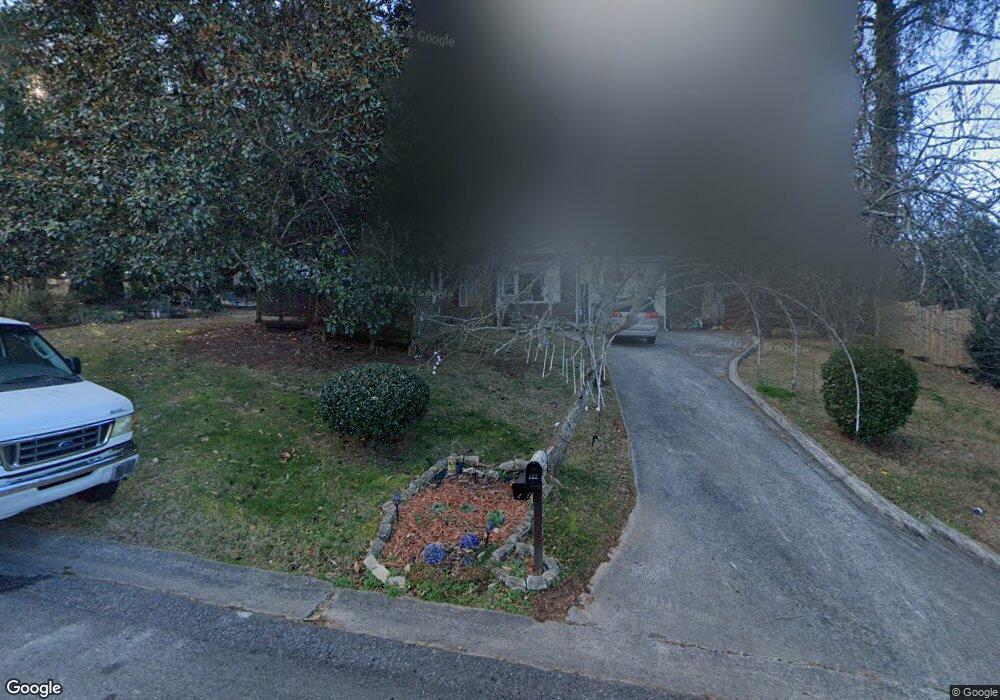
This home is located at 102 Azalea St SE, Rome, GA 30161 and is currently estimated at $224,721, approximately $132 per square foot. 102 Azalea St SE is a home located in Floyd County with nearby schools including Pepperell Middle School, Pepperell High School, and Montessori School of Rome.
Ownership History
Date
Name
Owned For
Owner Type
Purchase Details
Closed on
Jul 5, 2004
Bought by
P and R
Current Estimated Value
Purchase Details
Closed on
Jan 4, 1999
Sold by
Loyd Paula Jeanne
Bought by
Loyd Paula Jeanne and Bowers James R
Purchase Details
Closed on
Jul 28, 1998
Bought by
P and R
Purchase Details
Closed on
Feb 3, 1995
Sold by
Loyd Stuart E and Paula Jeanne
Bought by
Loyd Paula Jeanne
Purchase Details
Closed on
Apr 15, 1987
Sold by
Paris Albert E Paris Albert E Paris
Bought by
Loyd Stuart E and Paula Jeanne
Purchase Details
Closed on
Mar 27, 1980
Sold by
P\R
Bought by
Paris Albert E Paris Albert E Paris
Purchase Details
Closed on
Jun 30, 1977
Sold by
P\R
Bought by
Jones Charles A and Jones Hazel
Purchase Details
Closed on
Sep 1, 1962
Sold by
Clyde Davis Bldrs Inc Clyde Davis Bldrs
Bought by
Lambert Von Lambert Von Lambert Von
Purchase Details
Closed on
Sep 1, 1961
Bought by
Clyde Davis Bldrs Inc Clyde Davis Bldrs
Create a Home Valuation Report for This Property
The Home Valuation Report is an in-depth analysis detailing your home's value as well as a comparison with similar homes in the area
Home Values in the Area
Average Home Value in this Area
Purchase History
| Date | Buyer | Sale Price | Title Company |
|---|---|---|---|
| P | -- | -- | |
| Loyd Paula Jeanne | -- | -- | |
| P | -- | -- | |
| Loyd Paula Jeanne | -- | -- | |
| Loyd Stuart E | $45,000 | -- | |
| Paris Albert E Paris Albert E Paris | $34,000 | -- | |
| Jones Charles A | -- | -- | |
| P\R | $34,500 | -- | |
| Lambert Von Lambert Von Lambert Von | -- | -- | |
| Clyde Davis Bldrs Inc Clyde Davis Bldrs | -- | -- |
Source: Public Records
Tax History Compared to Growth
Tax History
| Year | Tax Paid | Tax Assessment Tax Assessment Total Assessment is a certain percentage of the fair market value that is determined by local assessors to be the total taxable value of land and additions on the property. | Land | Improvement |
|---|---|---|---|---|
| 2024 | $1,284 | $88,512 | $12,204 | $76,308 |
| 2023 | $1,231 | $85,198 | $10,848 | $74,350 |
| 2022 | $1,023 | $71,321 | $9,040 | $62,281 |
| 2021 | $800 | $58,376 | $9,040 | $49,336 |
| 2020 | $557 | $53,952 | $6,780 | $47,172 |
| 2019 | $394 | $45,542 | $6,780 | $38,762 |
| 2018 | $356 | $43,467 | $6,780 | $36,687 |
| 2017 | $314 | $41,148 | $6,780 | $34,368 |
| 2016 | $357 | $43,280 | $6,760 | $36,520 |
| 2015 | $1,064 | $43,840 | $6,760 | $37,080 |
| 2014 | $1,064 | $44,000 | $6,760 | $37,240 |
Source: Public Records
Map
Nearby Homes
- 107 E Linden St SE
- 2501 Maple Rd SE
- 211 Alfred Ave SE
- 2508 Maple Rd SE
- 2523 Maple Rd SE
- 36 Saddle Mountain Rd SE
- 212 Alfred Ave SE
- 3 Belmont Ct SE
- 15 Saddlebrook Dr SE
- 2107 Rockmart Rd SE
- 109 Chateau Dr SE
- 105 Chateau Dr SE
- 2710 Maple Rd SE
- 211 Chateau Dr SE
- 2108 Maple Ave SW
- 7 Willingham St SW
- 20 Coventry Dr SE
- 22 Coventry Dr SE
- 0 Martha Berry Hwy Unit 7525627
- 100 Azalea St SE
- 106 Azalea St SE
- 32 Rosemont Dr SE
- 2603 Flannery St SE
- 2433 Flannery St SE
- 33 Rosemont Dr SE
- 30 Rosemont Dr SE
- 2605 Flannery St SE
- 2431 Flannery St SE
- 31 Rosemont Dr SE
- 2607 Flannery St SE
- 28 Rosemont Dr SE
- 19 Azalea St SE
- 16 Azalea St SE
- 2429 Flannery St SE
- 29 Rosemont Dr SE
- 17 Azalea St SE
- 2609 Flannery St SE
- 26 Rosemont Dr SE
- 14 Azalea St SE