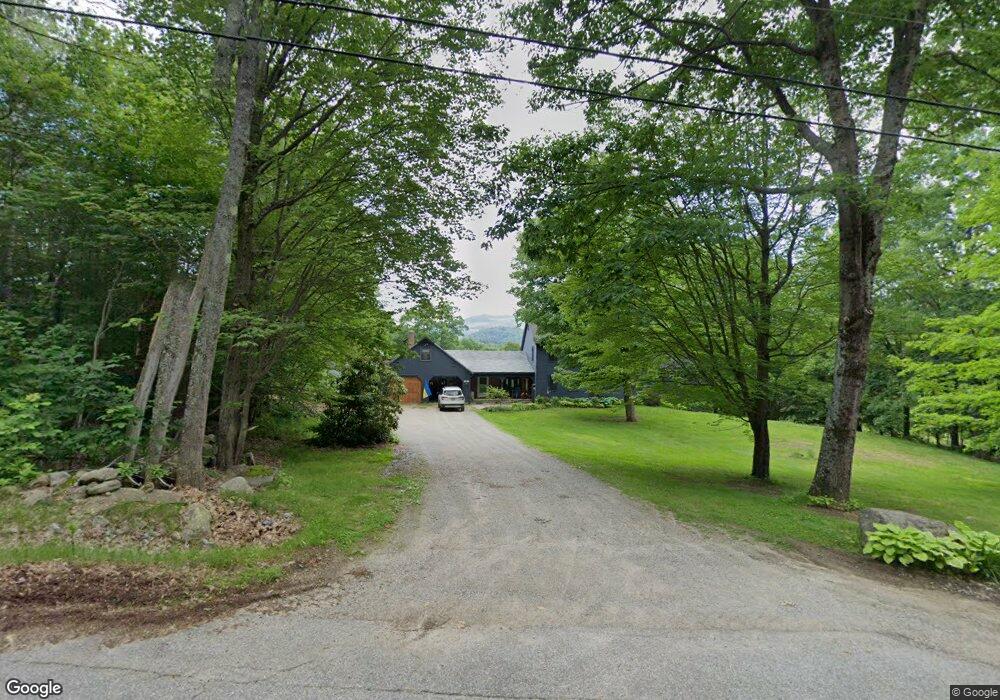
102 Beech Hill Rd Andover, NH 03216
Estimated Value: $611,000 - $939,000
3
Beds
3
Baths
3,042
Sq Ft
$253/Sq Ft
Est. Value
About This Home
This home is located at 102 Beech Hill Rd, Andover, NH 03216 and is currently estimated at $768,910, approximately $252 per square foot. 102 Beech Hill Rd is a home located in Merrimack County with nearby schools including Andover Elementary Middle School, Merrimack Valley High School, and Proctor Academy.
Ownership History
Date
Name
Owned For
Owner Type
Purchase Details
Closed on
May 11, 2022
Sold by
Tuttle Harold D and Tuttle Linda J
Bought by
Harold Tuttle 2020 T and Harold Tuttle
Current Estimated Value
Home Financials for this Owner
Home Financials are based on the most recent Mortgage that was taken out on this home.
Original Mortgage
$382,000
Interest Rate
5.27%
Mortgage Type
Stand Alone Refi Refinance Of Original Loan
Purchase Details
Closed on
Apr 16, 2020
Sold by
Macbride Linda J and Tuttle Harold D
Bought by
Harold Tuttle 2020 T
Purchase Details
Closed on
Nov 13, 2012
Sold by
Mcleod Wendy J
Bought by
Tuttle Harold D and Mcbride Linda J
Create a Home Valuation Report for This Property
The Home Valuation Report is an in-depth analysis detailing your home's value as well as a comparison with similar homes in the area
Home Values in the Area
Average Home Value in this Area
Purchase History
| Date | Buyer | Sale Price | Title Company |
|---|---|---|---|
| Harold Tuttle 2020 T | -- | None Available | |
| Tuttle Harold D | -- | None Available | |
| Tuttle Harold D | -- | None Available | |
| Tuttle Harold D | -- | None Available | |
| Harold Tuttle 2020 T | -- | None Available | |
| Harold Tuttle 2020 T | -- | None Available | |
| Tuttle Harold D | $255,000 | -- | |
| Tuttle Harold D | $255,000 | -- |
Source: Public Records
Mortgage History
| Date | Status | Borrower | Loan Amount |
|---|---|---|---|
| Previous Owner | Tuttle Harold D | $382,000 | |
| Previous Owner | Tuttle Harold D | $75,000 | |
| Previous Owner | Tuttle Harold D | $50,000 | |
| Closed | Tuttle Harold D | $0 |
Source: Public Records
Tax History
| Year | Tax Paid | Tax Assessment Tax Assessment Total Assessment is a certain percentage of the fair market value that is determined by local assessors to be the total taxable value of land and additions on the property. | Land | Improvement |
|---|---|---|---|---|
| 2025 | $10,532 | $718,900 | $148,900 | $570,000 |
| 2024 | $10,525 | $718,900 | $148,900 | $570,000 |
| 2023 | $8,806 | $383,700 | $84,600 | $299,100 |
| 2022 | $8,131 | $383,700 | $84,600 | $299,100 |
| 2021 | $8,023 | $383,700 | $84,600 | $299,100 |
| 2020 | $8,175 | $383,100 | $84,600 | $298,500 |
| 2019 | $8,290 | $383,100 | $84,600 | $298,500 |
| 2018 | $7,744 | $318,400 | $78,900 | $239,500 |
| 2017 | $7,272 | $318,100 | $78,900 | $239,200 |
| 2016 | $6,763 | $318,100 | $78,900 | $239,200 |
| 2015 | $6,220 | $312,900 | $78,900 | $234,000 |
| 2014 | $6,377 | $312,900 | $78,900 | $234,000 |
| 2013 | $7,003 | $373,500 | $87,600 | $285,900 |
Source: Public Records
Map
Nearby Homes
- 151 Beech Hill Rd
- 58 Main St
- 97 Salisbury Hwy
- 19 Ives
- 289 Salisbury Hwy
- 32 Monticello Dr
- 516 W Salisbury Rd
- 760 Racoon Hill Rd
- 1057 Old Turnpike Rd
- Lot 4 Depot St
- 0 Putney Rd Unit 433
- 221 Campground Rd
- 32 Maple St
- 63 Old Winslow Rd
- 161 Tucker Mountain Rd
- 32 Deckmans Rd
- 881 Franklin Hwy
- Lot 8 Stone Bridge Rd
- 0 Howe Rd Unit 4996459
- 00 New Canada Rd Unit 7
- 110 Beech Hill Rd
- 115 Beech Hill Rd
- 118 Beech Hill Rd
- 125 Beech Hill Rd
- 135 Beech Hill Rd
- 74 Beech Hill Rd
- 142 Beech Hill Rd
- 162 Beech Hill Rd
- 63 Beech Hill Rd
- 1 Beech Hill Rd
- 89 Beech Hill Rd
- 82 Bradley Lake Rd
- 53 Bradley Lake Rd
- 91 Bradley Lake Rd
- 171 Beech Hill Rd
- 30 Beech Hill Rd
- 56 Bradley Lake Rd
- 28 Bradley Lake Rd
- 188 Beech Hill Rd
- 27 Bradley Lake Rd
Your Personal Tour Guide
Ask me questions while you tour the home.