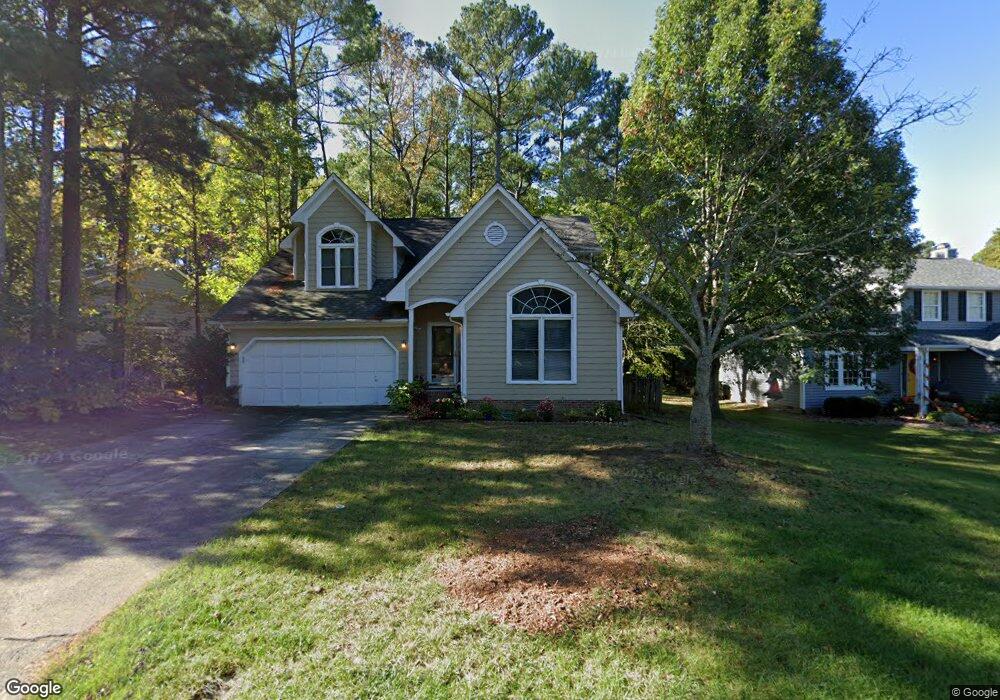
102 Blue Ridge Ct Durham, NC 27703
Estimated Value: $451,000 - $465,000
3
Beds
3
Baths
2,134
Sq Ft
$215/Sq Ft
Est. Value
About This Home
This home is located at 102 Blue Ridge Ct, Durham, NC 27703 and is currently estimated at $458,563, approximately $214 per square foot. 102 Blue Ridge Ct is a home located in Durham County with nearby schools including Bethesda Elementary School, John W Neal Middle School, and Southern School of Energy & Sustainability.
Ownership History
Date
Name
Owned For
Owner Type
Purchase Details
Closed on
Oct 30, 2015
Sold by
Ingle Trenton and Ingle Molly
Bought by
Lubble Cindy L and Lubble Thomas C
Current Estimated Value
Home Financials for this Owner
Home Financials are based on the most recent Mortgage that was taken out on this home.
Original Mortgage
$128,000
Outstanding Balance
$52,706
Interest Rate
3.89%
Mortgage Type
New Conventional
Estimated Equity
$405,857
Purchase Details
Closed on
Jun 17, 2010
Sold by
Ingle Trenton and Kemble Tonya
Bought by
Ingle Trenton
Purchase Details
Closed on
Aug 23, 2004
Sold by
Jennings Mark H and Jennings Jennifer G
Bought by
Ingle Trenton and Ingle Tonyn
Home Financials for this Owner
Home Financials are based on the most recent Mortgage that was taken out on this home.
Original Mortgage
$161,600
Interest Rate
5.5%
Mortgage Type
New Conventional
Purchase Details
Closed on
Jun 15, 1998
Sold by
Clary Bryan M and Clary Monica A
Bought by
Jennings Mark H and Jennings Jenniffer G
Home Financials for this Owner
Home Financials are based on the most recent Mortgage that was taken out on this home.
Original Mortgage
$121,600
Interest Rate
7.14%
Create a Home Valuation Report for This Property
The Home Valuation Report is an in-depth analysis detailing your home's value as well as a comparison with similar homes in the area
Home Values in the Area
Average Home Value in this Area
Purchase History
| Date | Buyer | Sale Price | Title Company |
|---|---|---|---|
| Lubble Cindy L | $218,000 | Investors Title Insurance Co | |
| Ingle Trenton | -- | None Available | |
| Ingle Trenton | $202,000 | -- | |
| Jennings Mark H | $152,000 | -- |
Source: Public Records
Mortgage History
| Date | Status | Borrower | Loan Amount |
|---|---|---|---|
| Open | Lubble Cindy L | $128,000 | |
| Closed | Lubble Cindy L | $46,400 | |
| Previous Owner | Ingle Trenton | $161,600 | |
| Previous Owner | Jennings Mark H | $121,600 | |
| Closed | Ingle Trenton | $40,400 |
Source: Public Records
Tax History Compared to Growth
Tax History
| Year | Tax Paid | Tax Assessment Tax Assessment Total Assessment is a certain percentage of the fair market value that is determined by local assessors to be the total taxable value of land and additions on the property. | Land | Improvement |
|---|---|---|---|---|
| 2025 | $4,360 | $439,779 | $126,000 | $313,779 |
| 2024 | $3,432 | $246,032 | $47,840 | $198,192 |
| 2023 | $3,223 | $246,032 | $47,840 | $198,192 |
| 2022 | $3,149 | $246,032 | $47,840 | $198,192 |
| 2021 | $3,134 | $246,032 | $47,840 | $198,192 |
| 2020 | $3,060 | $246,032 | $47,840 | $198,192 |
| 2019 | $2,971 | $238,881 | $47,840 | $191,041 |
| 2018 | $2,707 | $199,586 | $35,880 | $163,706 |
| 2017 | $2,687 | $199,586 | $35,880 | $163,706 |
| 2016 | $2,597 | $199,586 | $35,880 | $163,706 |
| 2015 | $2,760 | $199,407 | $34,451 | $164,956 |
| 2014 | $2,760 | $199,407 | $34,451 | $164,956 |
Source: Public Records
Map
Nearby Homes
- 5014 Rolling Meadows Dr
- 3610 Long Ridge Rd
- 3602 Appling Way
- 2905 Scuppernong Ln
- 2701 Skybrook Ln
- 2811 Skybrook Ln
- 5411 Suda Dr
- 342 Westgrove Ct
- 5226 Malik Dr
- 107 Vickery Hill Ct
- 5225 Dilbagh Dr
- 2228 Cedar Grove Dr
- 1130 Bacchanal Ln
- 1130 Bacchanal Ln Unit 19
- 5216 Dilbagh Dr
- 2214 Tw Alexander Dr
- 227 Westgrove Ct
- 106 Torrey Heights Ln
- 2709 Hamilton Green Dr
- 145 Torrey Heights Ln
- 106 Blue Ridge Ct
- 3404 Appling Way
- 108 Blue Ridge Ct
- 103 Blue Ridge Ct
- 101 Blue Ridge Ct
- 107 Blue Ridge Ct
- 3318 Appling Way
- 2 Home Croft Ct
- 110 Blue Ridge Ct
- 5117 Huxey Glenn Ct
- 3 Indian Head Ct
- 109 Blue Ridge Ct
- 5115 Huxey Glenn Ct
- 3407 Appling Way
- 4 Indian Head Ct
- 112 Blue Ridge Ct
- 3316 Appling Way
- 4 Home Croft Ct
- 3 Seville Ct
- 5118 Huxey Glenn Ct