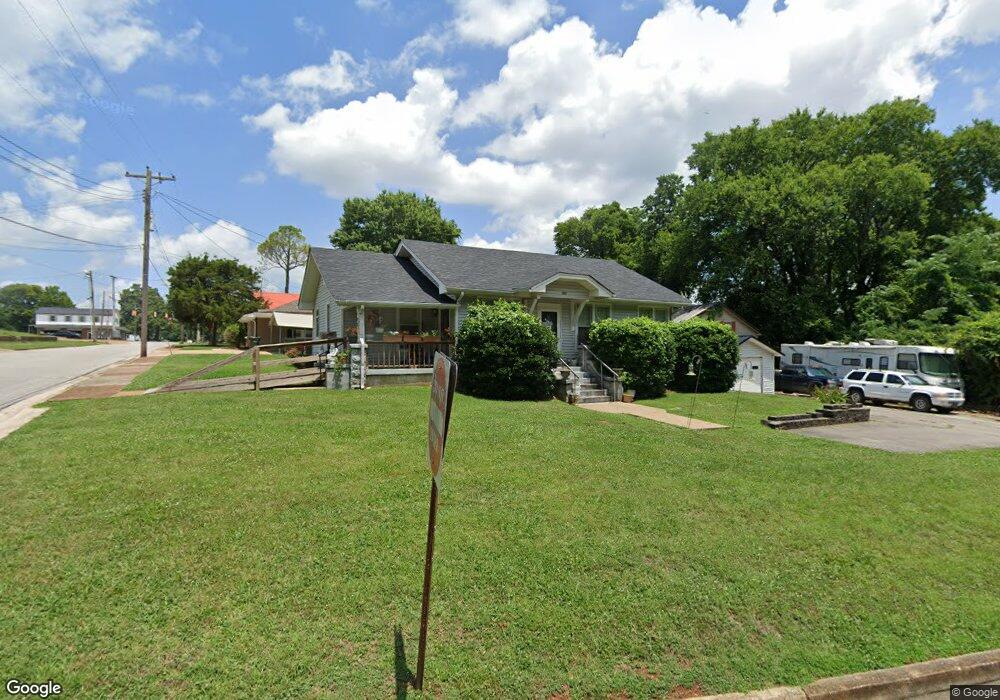
102 Buffalo Rd Unit 10 Lawrenceburg, TN 38464
Estimated Value: $133,000 - $199,142
3
Beds
2
Baths
1,680
Sq Ft
$100/Sq Ft
Est. Value
About This Home
This home is located at 102 Buffalo Rd Unit 10, Lawrenceburg, TN 38464 and is currently estimated at $167,536, approximately $99 per square foot. 102 Buffalo Rd Unit 10 is a home located in Lawrence County with nearby schools including Ingram Sowell Elementary School, David Crockett Elementary School, and Lawrenceburg Public Elementary School.
Ownership History
Date
Name
Owned For
Owner Type
Purchase Details
Closed on
Jun 2, 2025
Sold by
Matney Patricia J Farris
Bought by
Fishpaw Gerald Matthew and Fishpaw Pamela D
Current Estimated Value
Home Financials for this Owner
Home Financials are based on the most recent Mortgage that was taken out on this home.
Original Mortgage
$152,000
Outstanding Balance
$151,611
Interest Rate
6.83%
Mortgage Type
New Conventional
Estimated Equity
$15,925
Purchase Details
Closed on
Mar 3, 2006
Bought by
Matney Patricia J Farris
Purchase Details
Closed on
Aug 25, 1989
Bought by
Farris Jewell D and Farris Patricia
Purchase Details
Closed on
Dec 28, 1987
Bought by
Rowe Johnnie R Barbara Rowe Storrie
Purchase Details
Closed on
Jan 1, 1981
Create a Home Valuation Report for This Property
The Home Valuation Report is an in-depth analysis detailing your home's value as well as a comparison with similar homes in the area
Home Values in the Area
Average Home Value in this Area
Purchase History
| Date | Buyer | Sale Price | Title Company |
|---|---|---|---|
| Fishpaw Gerald Matthew | $160,000 | None Listed On Document | |
| Fishpaw Gerald Matthew | $160,000 | None Listed On Document | |
| Matney Patricia J Farris | -- | -- | |
| Farris Jewell D | -- | -- | |
| Rowe Johnnie R Barbara Rowe Storrie | -- | -- | |
| -- | $7,800 | -- |
Source: Public Records
Mortgage History
| Date | Status | Borrower | Loan Amount |
|---|---|---|---|
| Open | Fishpaw Gerald Matthew | $152,000 | |
| Closed | Fishpaw Gerald Matthew | $152,000 |
Source: Public Records
Tax History Compared to Growth
Tax History
| Year | Tax Paid | Tax Assessment Tax Assessment Total Assessment is a certain percentage of the fair market value that is determined by local assessors to be the total taxable value of land and additions on the property. | Land | Improvement |
|---|---|---|---|---|
| 2025 | $762 | $24,500 | $0 | $0 |
| 2024 | $762 | $24,500 | $2,125 | $22,375 |
| 2023 | $762 | $24,500 | $2,125 | $22,375 |
| 2022 | $762 | $24,500 | $2,125 | $22,375 |
| 2021 | $673 | $15,300 | $2,125 | $13,175 |
| 2020 | $673 | $15,300 | $2,125 | $13,175 |
| 2019 | $673 | $15,300 | $2,125 | $13,175 |
| 2018 | $673 | $15,300 | $2,125 | $13,175 |
| 2017 | $673 | $15,300 | $2,125 | $13,175 |
| 2016 | $673 | $15,300 | $2,125 | $13,175 |
| 2015 | $637 | $15,300 | $2,125 | $13,175 |
| 2014 | $640 | $15,375 | $2,125 | $13,250 |
Source: Public Records
Map
Nearby Homes
- 108 Buffalo Rd
- 219 Waterloo St
- 113 W Taylor St
- 222 Groh St
- 213 Pulaski St
- 316 S Military Ave
- 409 N Military Ave
- 426 Frank St
- 209 Frank St
- 215 Depot St
- 0 Woodland Dr Unit RTC2772580
- 0 Stewart St
- 511 S Locust Ave
- 330 Cocke St
- 417 Brush Creek Rd
- 310 May St
- 802 Mahr Ave
- 845 Gaither Ave
- 806 Fair Ave
- 220 Jackson Ave
- 346 Waterloo St
- 112 Buffalo Rd
- 103 Buffalo Rd
- 400 Waterloo St
- 338 Waterloo St
- 120 Buffalo Rd
- 109 Buffalo Rd
- 334 Waterloo St
- 412 Waterloo St
- 328 Waterloo St
- 399 W Gaines St
- 401 W Gaines St Unit C
- 401 W Gaines St Unit E
- 401 W Gaines St Unit A
- 401 W Gaines St Unit B
- 322 Waterloo St
- 311 Waterloo St
- 401 Bella Way Plaza Unit E
- 401 Bella Way Plaza Unit C
- 401 Bella Way Plaza Unit B