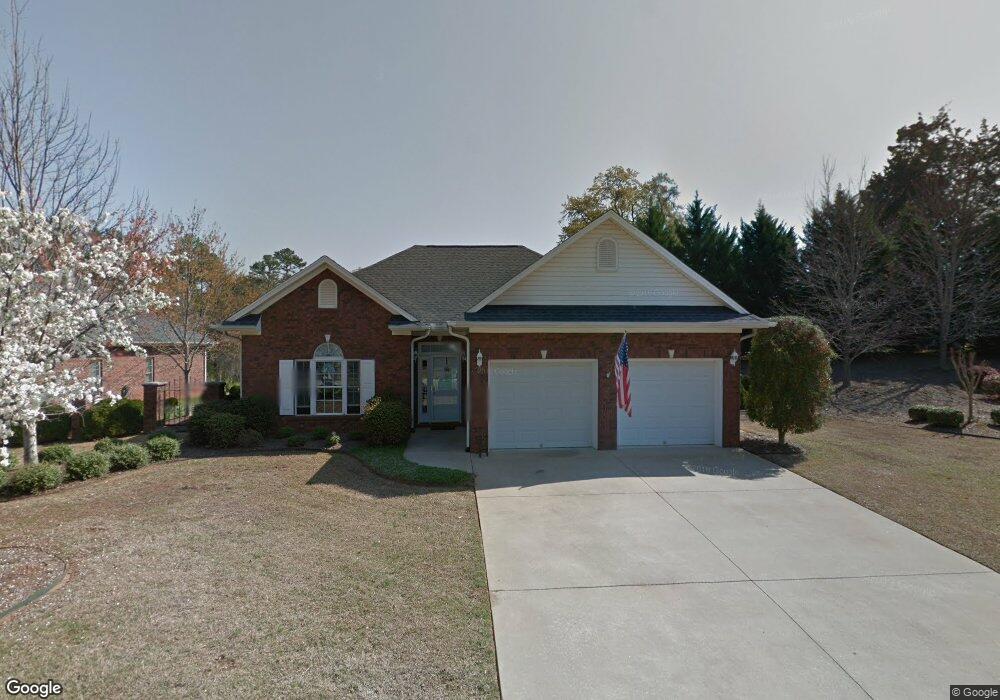
102 Camelot Dr Unit Lot 1 The Crossing Seneca, SC 29672
Estimated Value: $320,000 - $433,000
3
Beds
2
Baths
1,524
Sq Ft
$250/Sq Ft
Est. Value
About This Home
This home is located at 102 Camelot Dr Unit Lot 1 The Crossing, Seneca, SC 29672 and is currently estimated at $380,949, approximately $249 per square foot. 102 Camelot Dr Unit Lot 1 The Crossing is a home located in Oconee County with nearby schools including Northside Elementary School, Seneca Middle School, and Seneca High School.
Ownership History
Date
Name
Owned For
Owner Type
Purchase Details
Closed on
Sep 25, 2019
Sold by
Gillespie Charles E and Gillespie Opal C
Bought by
Hotz Ellen Elizabeth
Current Estimated Value
Home Financials for this Owner
Home Financials are based on the most recent Mortgage that was taken out on this home.
Original Mortgage
$228,000
Outstanding Balance
$152,003
Interest Rate
3.5%
Mortgage Type
New Conventional
Estimated Equity
$228,946
Purchase Details
Closed on
Jun 6, 2019
Sold by
Cowles Ann L
Bought by
Gillespie Charles E and Gillespie Opal C
Purchase Details
Closed on
Oct 12, 2009
Sold by
Williams Frances G
Bought by
Cowles Ann L and Littlefield Earl E
Home Financials for this Owner
Home Financials are based on the most recent Mortgage that was taken out on this home.
Original Mortgage
$168,000
Interest Rate
5.04%
Mortgage Type
New Conventional
Create a Home Valuation Report for This Property
The Home Valuation Report is an in-depth analysis detailing your home's value as well as a comparison with similar homes in the area
Home Values in the Area
Average Home Value in this Area
Purchase History
| Date | Buyer | Sale Price | Title Company |
|---|---|---|---|
| Hotz Ellen Elizabeth | $249,000 | None Available | |
| Gillespie Charles E | $225,000 | None Available | |
| Cowles Ann L | $210,000 | -- |
Source: Public Records
Mortgage History
| Date | Status | Borrower | Loan Amount |
|---|---|---|---|
| Open | Hotz Ellen Elizabeth | $228,000 | |
| Previous Owner | Cowles Ann L | $168,000 |
Source: Public Records
Tax History Compared to Growth
Tax History
| Year | Tax Paid | Tax Assessment Tax Assessment Total Assessment is a certain percentage of the fair market value that is determined by local assessors to be the total taxable value of land and additions on the property. | Land | Improvement |
|---|---|---|---|---|
| 2024 | $884 | $10,428 | $976 | $9,452 |
| 2023 | $896 | $10,428 | $976 | $9,452 |
| 2022 | $896 | $10,428 | $976 | $9,452 |
| 2021 | $633 | $9,910 | $976 | $8,934 |
| 2020 | $633 | $9,910 | $976 | $8,934 |
| 2019 | $633 | $0 | $0 | $0 |
| 2018 | $1,706 | $0 | $0 | $0 |
| 2017 | $680 | $0 | $0 | $0 |
| 2016 | $680 | $0 | $0 | $0 |
| 2015 | -- | $0 | $0 | $0 |
| 2014 | -- | $7,476 | $1,144 | $6,333 |
| 2013 | -- | $0 | $0 | $0 |
Source: Public Records
Map
Nearby Homes
- 79 Angus Run
- 77 Angus Run
- 504 Bolick St
- 202 Steepleton Way
- 42 Angus Run
- 8006 Keowee School Rd
- Tract 4 Keowee School Rd
- 260 Meridian Way
- 270 Meridian Way
- 500 Queen Annes Ln
- 734 Tanglewood Dr
- 125 Indian Oaks Rd
- 00 Wells Hwy
- 323 S Cove Rd
- 236 Joe Jen Dr
- 410 S Cove Rd
- 531 Sullivans Way
- 414 S Cove Rd
- 198 Cape Hatteras Dr
- 115 Arrowood Cir
- 102 Camelot Dr
- 106 Camelot Dr
- 140 Bountyland Rd
- 108 Camelot Dr
- 136 Bountyland Rd
- 110 Camelot Dr
- 112 Camelot Dr
- 323 Stephy Ln
- 114 Camelot Dr
- 210 Trammell Dr
- 000 Bountyland Rd
- 00 Bountyland Rd
- 0 Bountyland Rd
- 120 Camelot Dr
- Bountyland Rd
- 122 Camelot Dr
- 127 Bountyland Rd
- 123 Camelot Dr
- 125 Bountyland Rd
- 124 Camelot Dr