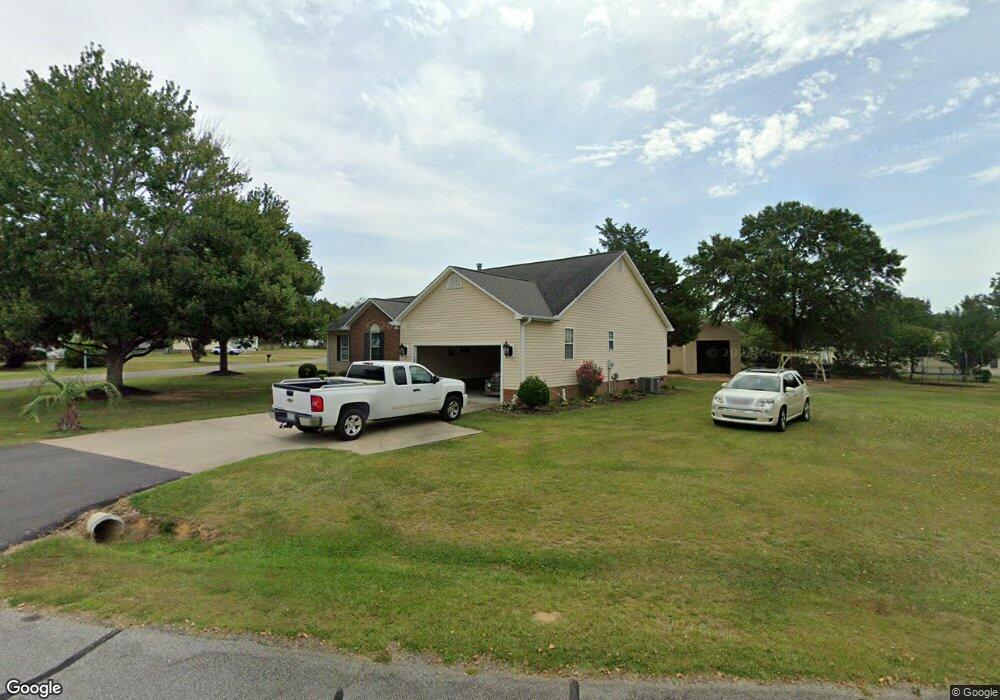
102 Canvas Back Ct Anderson, SC 29626
Estimated Value: $237,000 - $277,000
3
Beds
3
Baths
1,449
Sq Ft
$176/Sq Ft
Est. Value
About This Home
This home is located at 102 Canvas Back Ct, Anderson, SC 29626 and is currently estimated at $254,431, approximately $175 per square foot. 102 Canvas Back Ct is a home located in Anderson County with nearby schools including McLees Elementary School, Robert Anderson Middle School, and Westside High School.
Ownership History
Date
Name
Owned For
Owner Type
Purchase Details
Closed on
Sep 22, 2015
Sold by
Upstate Home Deals Llc
Bought by
Laycee Properties Llc
Current Estimated Value
Home Financials for this Owner
Home Financials are based on the most recent Mortgage that was taken out on this home.
Original Mortgage
$201,025
Interest Rate
3.97%
Mortgage Type
Purchase Money Mortgage
Purchase Details
Closed on
Mar 17, 2015
Sold by
Traynor Christopher T and Traynor Lisa H
Bought by
Upstate Home Deals Llc
Purchase Details
Closed on
Sep 21, 2006
Sold by
Plaster Lauralee and Seasock Lauralee P
Bought by
Traynor Christopher T and Traynor Lisa H
Home Financials for this Owner
Home Financials are based on the most recent Mortgage that was taken out on this home.
Original Mortgage
$120,000
Interest Rate
6.46%
Mortgage Type
Purchase Money Mortgage
Create a Home Valuation Report for This Property
The Home Valuation Report is an in-depth analysis detailing your home's value as well as a comparison with similar homes in the area
Home Values in the Area
Average Home Value in this Area
Purchase History
| Date | Buyer | Sale Price | Title Company |
|---|---|---|---|
| Laycee Properties Llc | $125,000 | -- | |
| Cdc Property Management Llc | $236,500 | -- | |
| Upstate Home Deals Llc | $77,500 | -- | |
| Traynor Christopher T | $120,000 | None Available |
Source: Public Records
Mortgage History
| Date | Status | Borrower | Loan Amount |
|---|---|---|---|
| Closed | Cdc Property Management Llc | $201,025 | |
| Closed | Laycee Properties Llc | $112,500 | |
| Previous Owner | Traynor Christopher T | $120,000 |
Source: Public Records
Tax History Compared to Growth
Tax History
| Year | Tax Paid | Tax Assessment Tax Assessment Total Assessment is a certain percentage of the fair market value that is determined by local assessors to be the total taxable value of land and additions on the property. | Land | Improvement |
|---|---|---|---|---|
| 2024 | $3,024 | $9,410 | $1,200 | $8,210 |
| 2023 | $3,024 | $9,410 | $1,200 | $8,210 |
| 2022 | $2,920 | $9,410 | $1,200 | $8,210 |
| 2021 | $2,690 | $8,070 | $1,200 | $6,870 |
| 2020 | $2,649 | $8,070 | $1,200 | $6,870 |
| 2019 | $2,649 | $8,070 | $1,200 | $6,870 |
| 2018 | $2,613 | $8,070 | $1,200 | $6,870 |
| 2017 | -- | $8,070 | $1,200 | $6,870 |
| 2016 | $2,389 | $4,790 | $480 | $4,310 |
| 2015 | $636 | $4,790 | $480 | $4,310 |
| 2014 | $631 | $4,790 | $480 | $4,310 |
Source: Public Records
Map
Nearby Homes
- 1053 Stoneham Cir
- 590 River Forks Rd
- 102 Tea Leaf Ct
- 102 Saint Clair Rd
- 1020 Providence Church Rd Unit Tract B
- 1020 Providence Church Rd Unit Tract 6
- 1020 Providence Church Rd Unit Tract 5
- 401 Broadwater Cir
- 385 New Hope Rd
- 401 New Hope Rd
- 800 Murphy Rd
- 123 Tc-11-46
- 102 Country Garden Ln
- 202 Highway 187 S
- 617 Walnut Way
- 215 Cedar St
- 4450 Highway 24 Hwy
- 612 Walnut Way
- 1037 Pearl Harbor Way
- 104 Canvas Back Ct
- 100 Canvas Back Ct
- 107 Sundowner Blvd
- 105 Canvas Back Ct
- 101 Canvas Back Ct
- 103 Sundowner Blvd
- 109 Sundowner Blvd
- 113 Canvas Back Ct
- 106 Canvas Back Ct
- 111 Sundowner Blvd
- 115 Canvas Back Ct
- 104 Sundowner Blvd
- 106 Sundowner Blvd
- 1415 Highway 187 S
- 102 Sundowner Blvd
- 108 Sundowner Blvd
- 113 Sundowner Blvd
- 108 Canvas Back Ct
- 110 Sundowner Blvd
- 110 Peninsula Dr