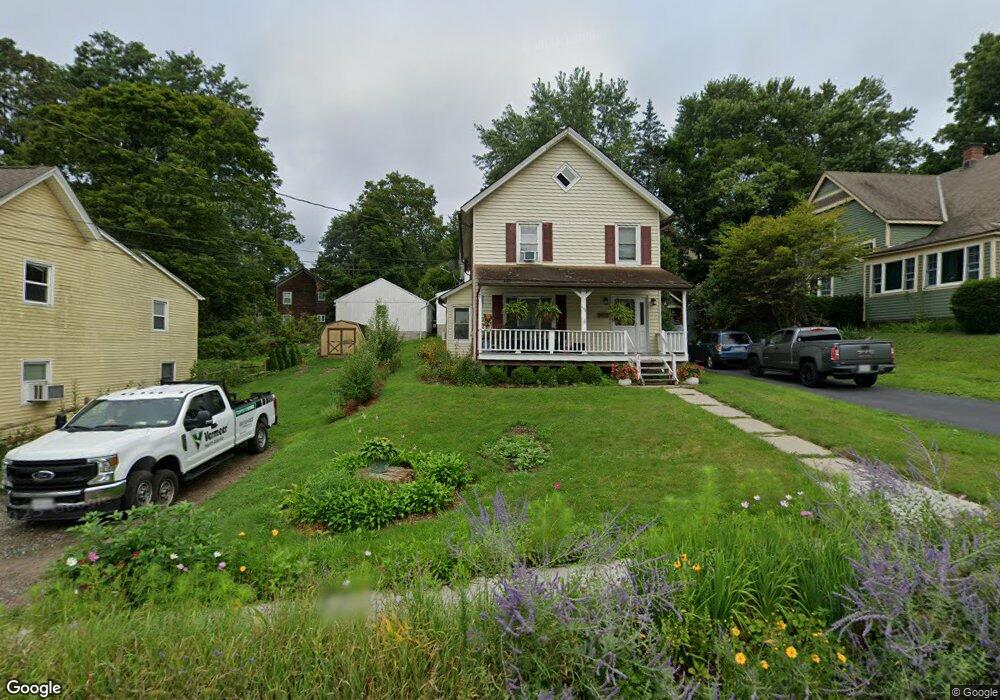
102 Charles Colman Blvd Pawling, NY 12564
Estimated Value: $346,531 - $447,000
4
Beds
1
Bath
1,260
Sq Ft
$309/Sq Ft
Est. Value
About This Home
This home is located at 102 Charles Colman Blvd, Pawling, NY 12564 and is currently estimated at $389,633, approximately $309 per square foot. 102 Charles Colman Blvd is a home located in Dutchess County with nearby schools including Pawling Elementary School, Pawling Middle School, and Pawling High School.
Ownership History
Date
Name
Owned For
Owner Type
Purchase Details
Closed on
Oct 30, 2006
Sold by
Ramsey Hilda
Bought by
Sheridan Paul
Current Estimated Value
Home Financials for this Owner
Home Financials are based on the most recent Mortgage that was taken out on this home.
Original Mortgage
$280,000
Outstanding Balance
$88,105
Interest Rate
6.48%
Mortgage Type
Purchase Money Mortgage
Estimated Equity
$301,528
Purchase Details
Closed on
Oct 7, 2005
Sold by
Ramsey Hilda
Bought by
Ramsey Hilda
Home Financials for this Owner
Home Financials are based on the most recent Mortgage that was taken out on this home.
Original Mortgage
$259,250
Interest Rate
5.85%
Mortgage Type
Purchase Money Mortgage
Purchase Details
Closed on
May 10, 2005
Sold by
Ramsey Hilda
Bought by
Ramsey Hilda
Home Financials for this Owner
Home Financials are based on the most recent Mortgage that was taken out on this home.
Original Mortgage
$219,000
Interest Rate
6%
Mortgage Type
Purchase Money Mortgage
Purchase Details
Closed on
Nov 3, 1999
Create a Home Valuation Report for This Property
The Home Valuation Report is an in-depth analysis detailing your home's value as well as a comparison with similar homes in the area
Home Values in the Area
Average Home Value in this Area
Purchase History
| Date | Buyer | Sale Price | Title Company |
|---|---|---|---|
| Sheridan Paul | $281,190 | -- | |
| Ramsey Hilda | -- | -- | |
| Ramsey Hilda | -- | -- | |
| -- | -- | -- |
Source: Public Records
Mortgage History
| Date | Status | Borrower | Loan Amount |
|---|---|---|---|
| Open | Sheridan Paul | $280,000 | |
| Previous Owner | Ramsey Hilda | $259,250 | |
| Previous Owner | Ramsey Hilda | $219,000 |
Source: Public Records
Tax History Compared to Growth
Tax History
| Year | Tax Paid | Tax Assessment Tax Assessment Total Assessment is a certain percentage of the fair market value that is determined by local assessors to be the total taxable value of land and additions on the property. | Land | Improvement |
|---|---|---|---|---|
| 2024 | $7,936 | $72,000 | $13,100 | $58,900 |
| 2023 | $6,044 | $72,000 | $13,100 | $58,900 |
| 2022 | $5,867 | $72,000 | $13,100 | $58,900 |
| 2021 | $5,831 | $72,000 | $13,100 | $58,900 |
| 2020 | $6,504 | $72,000 | $13,100 | $58,900 |
| 2019 | $6,556 | $72,000 | $13,100 | $58,900 |
| 2018 | $6,473 | $72,000 | $13,100 | $58,900 |
| 2017 | $4,852 | $72,000 | $13,100 | $58,900 |
| 2016 | $4,929 | $72,000 | $13,100 | $58,900 |
| 2015 | -- | $72,000 | $13,100 | $58,900 |
| 2014 | -- | $72,000 | $13,100 | $58,900 |
Source: Public Records
Map
Nearby Homes
- 98 Charles Colman Blvd
- 104 Charles Colman Blvd
- 33 Elm St
- 31 Elm St
- 37 Elm St
- 96 Charles Colman Blvd
- 108 Charles Colman Blvd
- 108 Charles Colman Blvd Unit 1
- 108 Charles Colman Blvd Unit 2
- 112 Charles Colman Blvd
- 94 Charles Colman Blvd Unit 3
- 94 Charles Colman Blvd Unit 2
- 94 Charles Colman Blvd Unit 1
- 94 Charles Colman Blvd
- 107 Charles Colman Blvd
- 101 Charles Colman Blvd
- 105 Charles Colman Blvd
- 114 Charles Colman Blvd
- 111 Charles Colman Blvd
- 42 Elm St