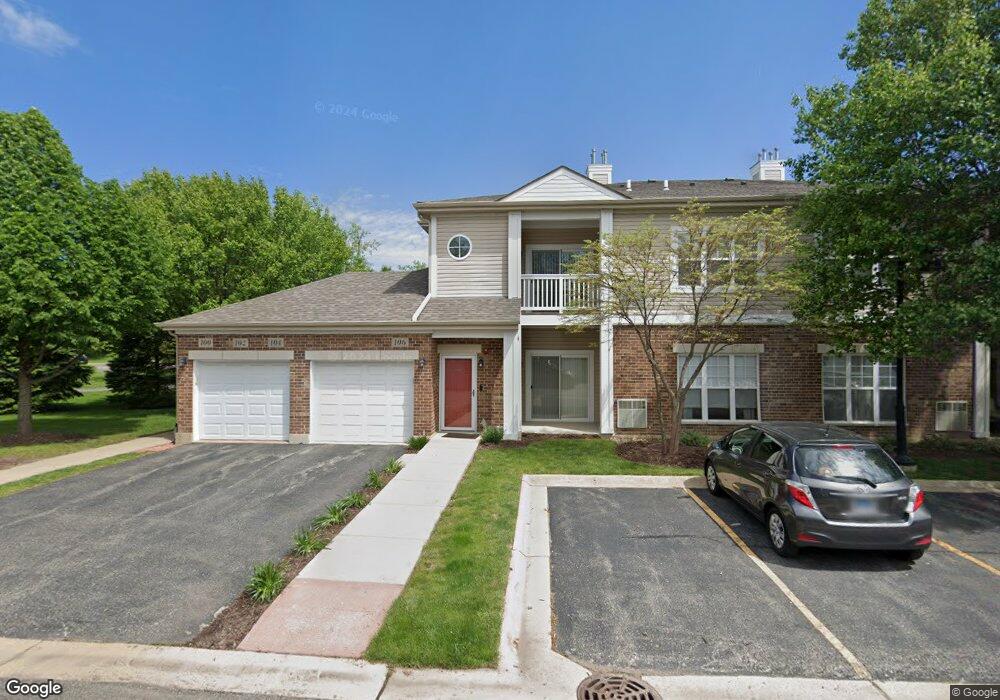
102 Clubhouse Ln Oswego, IL 60543
Northwest Oswego NeighborhoodEstimated Value: $223,000 - $238,000
2
Beds
1
Bath
1,150
Sq Ft
$201/Sq Ft
Est. Value
About This Home
This home is located at 102 Clubhouse Ln, Oswego, IL 60543 and is currently estimated at $230,840, approximately $200 per square foot. 102 Clubhouse Ln is a home located in Kendall County with nearby schools including Hunt Club Elementary School, Traughber Junior High School, and Oswego High School.
Ownership History
Date
Name
Owned For
Owner Type
Purchase Details
Closed on
Apr 28, 2021
Sold by
Mcnamara Eliza and Mcnamara John
Bought by
Dunham Matthew Chase and Dunham Dakota
Current Estimated Value
Home Financials for this Owner
Home Financials are based on the most recent Mortgage that was taken out on this home.
Original Mortgage
$158,083
Interest Rate
2.9%
Mortgage Type
FHA
Purchase Details
Closed on
Aug 23, 2014
Sold by
Neal Brian
Bought by
Mcnamara Eliza
Purchase Details
Closed on
Sep 26, 2007
Sold by
Neal Gerald R and Neal Lynda L
Bought by
Neal Lynda L
Purchase Details
Closed on
Jun 13, 2007
Sold by
Obrien Pine Ridge Club Inc
Bought by
Neal Gerald R and Neal Lynda L
Home Financials for this Owner
Home Financials are based on the most recent Mortgage that was taken out on this home.
Original Mortgage
$115,000
Interest Rate
6.42%
Mortgage Type
Purchase Money Mortgage
Create a Home Valuation Report for This Property
The Home Valuation Report is an in-depth analysis detailing your home's value as well as a comparison with similar homes in the area
Home Values in the Area
Average Home Value in this Area
Purchase History
| Date | Buyer | Sale Price | Title Company |
|---|---|---|---|
| Dunham Matthew Chase | $161,000 | Fidelity National Title | |
| Mcnamara Eliza | $92,500 | First American Title | |
| Neal Lynda L | -- | None Available | |
| Neal Gerald R | -- | None Available | |
| Neal Gerald R | $196,000 | First American Title |
Source: Public Records
Mortgage History
| Date | Status | Borrower | Loan Amount |
|---|---|---|---|
| Previous Owner | Dunham Matthew Chase | $158,083 | |
| Previous Owner | Neal Gerald R | $115,000 |
Source: Public Records
Tax History Compared to Growth
Tax History
| Year | Tax Paid | Tax Assessment Tax Assessment Total Assessment is a certain percentage of the fair market value that is determined by local assessors to be the total taxable value of land and additions on the property. | Land | Improvement |
|---|---|---|---|---|
| 2024 | $3,991 | $55,976 | $5,713 | $50,263 |
| 2023 | $4,065 | $49,979 | $5,101 | $44,878 |
| 2022 | $4,065 | $45,374 | $4,631 | $40,743 |
| 2021 | $3,868 | $41,670 | $4,631 | $37,039 |
| 2020 | $3,683 | $39,573 | $4,631 | $34,942 |
| 2019 | $3,598 | $38,054 | $4,453 | $33,601 |
| 2018 | $2,784 | $33,808 | $4,453 | $29,355 |
| 2017 | $2,508 | $30,431 | $4,453 | $25,978 |
| 2016 | $1,159 | $28,156 | $4,453 | $23,703 |
| 2015 | $1,070 | $25,427 | $4,040 | $21,387 |
| 2014 | -- | $27,037 | $4,040 | $22,997 |
| 2013 | -- | $31,808 | $4,753 | $27,055 |
Source: Public Records
Map
Nearby Homes
- 614 Pineridge Dr N Unit 43
- 618 Pineridge Dr N Unit 618
- 3373 Seeley St
- 517 Meadowwood Ln Unit 3
- 7619 Mill Rd
- LOT 10 SW Station Dr
- 424 Grape Vine Trail
- 4312 E Millbrook Cir
- 3199 Grande Trail
- 3187 Grande Trail
- 3185 Grande Trail
- 3183 Grande Trail
- 3181 Grande Trail
- 3179 Grande Trail
- 17 Basswood Ct
- 238 Willowwood Dr
- 3758 Bissel Dr
- Dominica Cay with Finished Basement Plan at The Colonies at Grande Reserve - Grande Reserve Ranch Homes
- Aruba Cove with Full Basement Plan at The Colonies at Grande Reserve - Grande Reserve Ranch Homes
- Cayman Isle with Full Basement Plan at The Colonies at Grande Reserve - Grande Reserve Ranch Homes
- 102 Clubhouse Ln Unit 102
- 102 Clubhouse Ln Unit 2
- 100 Clubhouse Ln
- 504 Pineridge Dr N Unit 13
- 122 Clubhouse Ln Unit 24
- 108 Clubhouse Ln Unit 24
- 126 Clubhouse Ln Unit 24
- 118 Clubhouse Ln Unit 19
- 112 Clubhouse Ln Unit 24
- 104 Clubhouse Ln Unit 28
- 110 Clubhouse Ln Unit 16
- 106 Clubhouse Ln Unit 30
- 120 Clubhouse Ln
- 112 Clubhouse Ln Unit 112
- 120 Clubhouse Ln Unit 27
- 104 Clubhouse Ln Unit 104
- 114 Clubhouse Ln Unit 26
- 114 Clubhouse Ln Unit 114
- 502 Pineridge Dr N Unit 5
- 506 Pineridge Dr N Unit 15