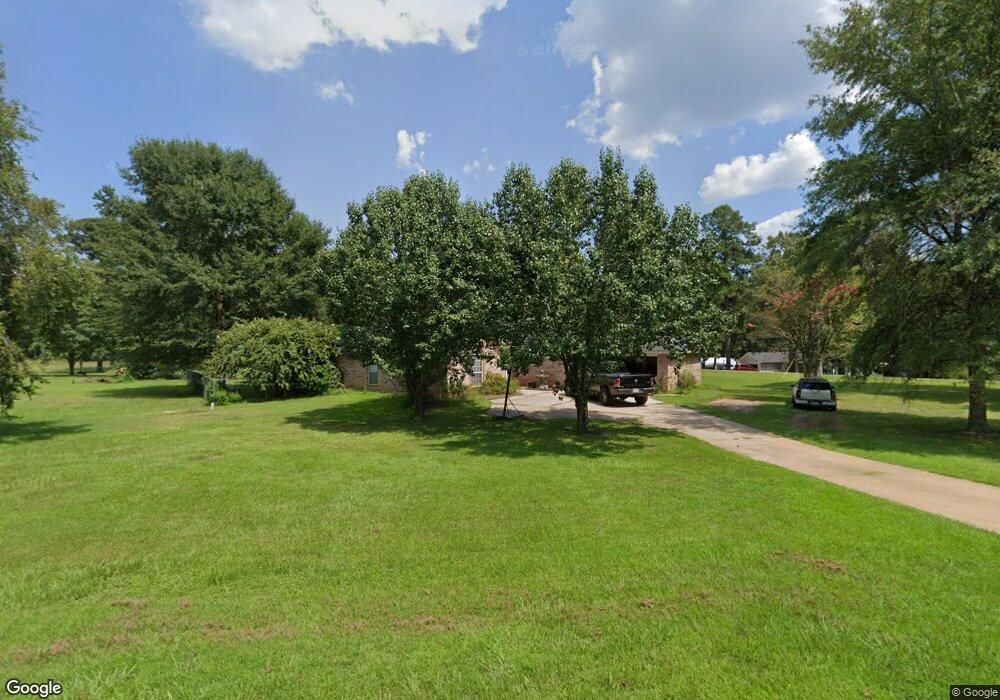
102 Cypress Point Ln Benton, LA 71006
Linton-Midway NeighborhoodEstimated Value: $281,000 - $375,000
3
Beds
2
Baths
1,830
Sq Ft
$187/Sq Ft
Est. Value
About This Home
This home is located at 102 Cypress Point Ln, Benton, LA 71006 and is currently estimated at $341,608, approximately $186 per square foot. 102 Cypress Point Ln is a home located in Bossier Parish with nearby schools including Benton Elementary School, Benton Middle School, and Benton High School.
Ownership History
Date
Name
Owned For
Owner Type
Purchase Details
Closed on
Jun 15, 2016
Sold by
Aycock Andrew Ryan
Bought by
Jordan Nicholas Lee and Jordan Stephanie
Current Estimated Value
Purchase Details
Closed on
Jul 30, 2013
Sold by
Mangham Donald Mark and Mangham Charlotte E
Bought by
Aycock Andrew Ryan
Home Financials for this Owner
Home Financials are based on the most recent Mortgage that was taken out on this home.
Original Mortgage
$178,762
Interest Rate
3.93%
Mortgage Type
Unknown
Purchase Details
Closed on
Mar 31, 2005
Sold by
Pittman Paul Anthony and Pittman Carole Bailey
Bought by
Mangham Donald Mark and Mangham Charlotte Elizabeth Oneal
Home Financials for this Owner
Home Financials are based on the most recent Mortgage that was taken out on this home.
Original Mortgage
$35,600
Interest Rate
5.71%
Mortgage Type
Unknown
Create a Home Valuation Report for This Property
The Home Valuation Report is an in-depth analysis detailing your home's value as well as a comparison with similar homes in the area
Home Values in the Area
Average Home Value in this Area
Purchase History
| Date | Buyer | Sale Price | Title Company |
|---|---|---|---|
| Jordan Nicholas Lee | $239,900 | Multiple | |
| Aycock Andrew Ryan | $175,000 | Multiple | |
| Mangham Donald Mark | $178,000 | None Available |
Source: Public Records
Mortgage History
| Date | Status | Borrower | Loan Amount |
|---|---|---|---|
| Previous Owner | Aycock Andrew Ryan | $178,762 | |
| Previous Owner | Mangham Donald Mark | $35,600 |
Source: Public Records
Tax History Compared to Growth
Tax History
| Year | Tax Paid | Tax Assessment Tax Assessment Total Assessment is a certain percentage of the fair market value that is determined by local assessors to be the total taxable value of land and additions on the property. | Land | Improvement |
|---|---|---|---|---|
| 2024 | $2,149 | $25,151 | $3,500 | $21,651 |
| 2023 | $1,826 | $21,600 | $3,500 | $18,100 |
| 2022 | $1,817 | $21,600 | $3,500 | $18,100 |
| 2021 | $1,788 | $21,600 | $3,500 | $18,100 |
| 2020 | $1,788 | $21,600 | $3,500 | $18,100 |
| 2019 | $1,804 | $21,556 | $3,500 | $18,056 |
| 2018 | $1,804 | $21,472 | $3,500 | $17,972 |
| 2017 | $1,773 | $21,472 | $3,500 | $17,972 |
| 2016 | $1,773 | $21,472 | $3,500 | $17,972 |
| 2015 | $1,280 | $18,110 | $2,210 | $15,900 |
| 2014 | $1,279 | $18,110 | $2,210 | $15,900 |
Source: Public Records
Map
Nearby Homes
- 522 Twin Point Dr
- 520 Calvin Dr
- 1401 Linton Rd
- 103 Deville Rd
- 2174 Twin Lake Dr
- 1345 Linton Rd
- 5046 Linton Cutoff Rd
- 0 Downs Dr
- 133 Downs Dr
- 285 Danielle Dr
- 45 Turtle Creek Dr
- 37 Turtle Creek Dr
- 49 Turtle Creek Dr
- 35 Turtle Creek Dr
- 33 Turtle Creek Dr
- 53 Turtle Creek Dr
- 23 Turtle Creek Dr
- 19 Turtle Creek Dr
- 50 Turtle Creek Dr
- 90 Turtle Creek Dr
- 151 Twin Point Dr
- 139 Twin Point Dr
- 146 Twin Point Dr
- 108 Cypress Point Ln
- 152 Twin Point Dr
- 107 Cypress Point Ln
- 140 Twin Point Dr
- 137 Twin Point Dr
- 165 Twin Point Dr
- 158 Twin Point Dr
- 136 Twin Point Dr
- 112 Cypress Point Ln
- 430 Lintwin Cir
- 111 Cypress Point Ln
- 1428 Linton Rd
- 118 Cypress Point Ln
- 204 Twin Point Dr
- 129 Lintwin Cir
- 418 Lintwin Cir
- 119 Lintwin Cir