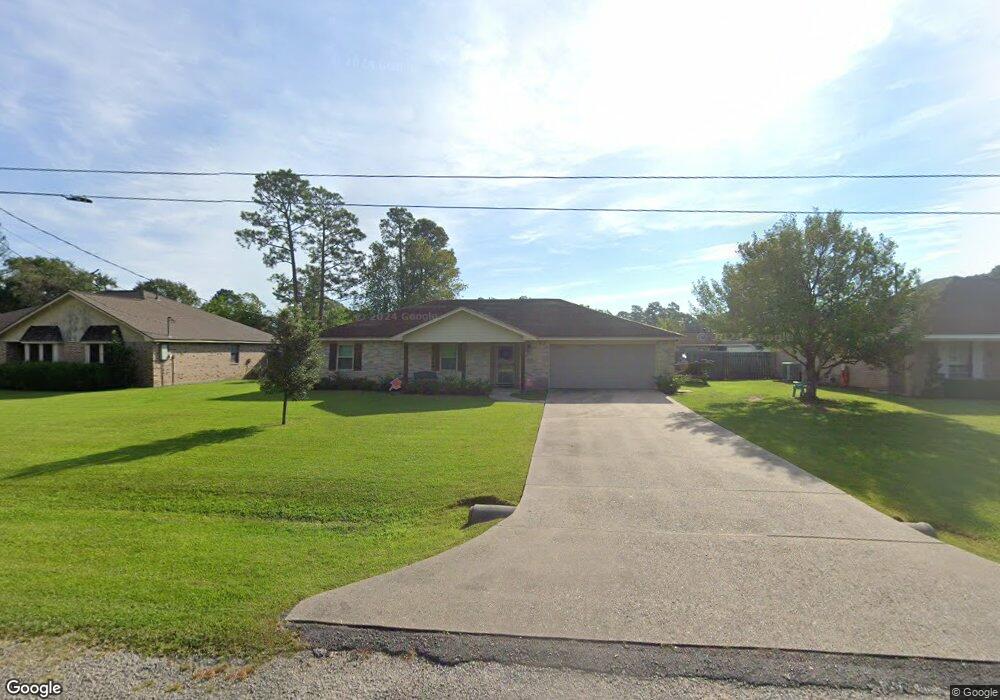
102 Darla Dr Lumberton, TX 77657
Estimated Value: $210,983 - $257,000
--
Bed
--
Bath
1,722
Sq Ft
$140/Sq Ft
Est. Value
About This Home
This home is located at 102 Darla Dr, Lumberton, TX 77657 and is currently estimated at $241,746, approximately $140 per square foot. 102 Darla Dr is a home located in Hardin County with nearby schools including Lumberton Intermediate School, Lumberton Primary School, and Lumberton Middle School.
Create a Home Valuation Report for This Property
The Home Valuation Report is an in-depth analysis detailing your home's value as well as a comparison with similar homes in the area
Home Values in the Area
Average Home Value in this Area
Tax History Compared to Growth
Tax History
| Year | Tax Paid | Tax Assessment Tax Assessment Total Assessment is a certain percentage of the fair market value that is determined by local assessors to be the total taxable value of land and additions on the property. | Land | Improvement |
|---|---|---|---|---|
| 2024 | $1,656 | $162,808 | $25,200 | $158,366 |
| 2023 | $1,491 | $148,007 | $25,200 | $162,426 |
| 2022 | $2,713 | $135,868 | $25,200 | $110,668 |
| 2021 | $2,299 | $136,610 | $25,200 | $111,410 |
| 2020 | $2,090 | $111,200 | $25,200 | $86,000 |
| 2019 | $2,150 | $110,660 | $25,200 | $85,460 |
| 2018 | $1,709 | $110,660 | $25,200 | $85,460 |
| 2017 | $2,184 | $110,660 | $25,200 | $85,460 |
| 2016 | $2,135 | $108,190 | $25,200 | $82,990 |
| 2015 | $1,691 | $108,190 | $25,200 | $82,990 |
| 2014 | $1,806 | $108,190 | $25,200 | $82,990 |
Source: Public Records
Map
Nearby Homes
- 125 Williams Rd
- 1520 Kalas Cir
- 1310 Natasha's Way
- 490 Hidden Grove Ct
- 1335 Natashas Way
- 1325 Natashas Way
- 1315 Natashas Way
- 1240 Natashas Way
- 1370 Natashas Way
- 1760 Kala's Cir
- 1305 Natashas Way
- 1295 Natashas Way
- 1335 Natasha's Way
- 90 Lamplighter St
- 1350 Jared Dr
- 1360 Jared Dr
- 1250 Jared
- 1710 Kalas Cir
- 1340 Natasha's Way
- 1300 Kalas Cir