Estimated Value: $149,000 - $232,000
5
Beds
2
Baths
1,188
Sq Ft
$171/Sq Ft
Est. Value
About This Home
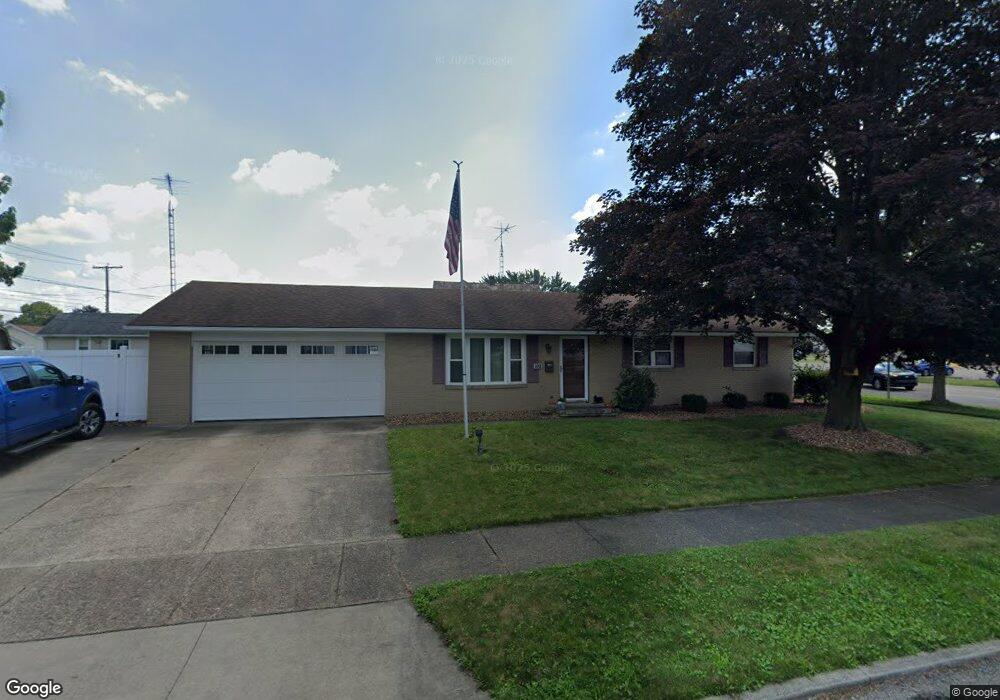
This home is located at 102 E Shafer Ave, Dover, OH 44622 and is currently estimated at $203,691, approximately $171 per square foot. 102 E Shafer Ave is a home located in Tuscarawas County with nearby schools including Dover High School, Tuscarawas Central Catholic Elementary School, and Tuscarawas Central Catholic Junior/Senior High School.
Ownership History
Date
Name
Owned For
Owner Type
Purchase Details
Closed on
May 4, 2021
Sold by
Smith Michelle L
Bought by
Smith Chad E
Current Estimated Value
Home Financials for this Owner
Home Financials are based on the most recent Mortgage that was taken out on this home.
Original Mortgage
$25,000
Outstanding Balance
$14,457
Interest Rate
2.3%
Mortgage Type
New Conventional
Estimated Equity
$189,234
Purchase Details
Closed on
Oct 28, 2011
Sold by
Head Joseph D
Bought by
Smith Chad E and Smith Michelle L
Home Financials for this Owner
Home Financials are based on the most recent Mortgage that was taken out on this home.
Original Mortgage
$75,000
Interest Rate
3.29%
Mortgage Type
FHA
Purchase Details
Closed on
Apr 18, 2000
Sold by
Gleaton Michael J
Bought by
Head Joseph D
Home Financials for this Owner
Home Financials are based on the most recent Mortgage that was taken out on this home.
Original Mortgage
$93,600
Interest Rate
8%
Mortgage Type
New Conventional
Create a Home Valuation Report for This Property
The Home Valuation Report is an in-depth analysis detailing your home's value as well as a comparison with similar homes in the area
Home Values in the Area
Average Home Value in this Area
Purchase History
| Date | Buyer | Sale Price | Title Company |
|---|---|---|---|
| Smith Chad E | -- | None Available | |
| Smith Chad E | $125,000 | Alban Title | |
| Head Joseph D | $117,000 | -- |
Source: Public Records
Mortgage History
| Date | Status | Borrower | Loan Amount |
|---|---|---|---|
| Open | Smith Chad E | $25,000 | |
| Open | Smith Chad E | $92,000 | |
| Closed | Smith Chad E | $75,000 | |
| Closed | Head Joseph D | $93,600 |
Source: Public Records
Tax History
| Year | Tax Paid | Tax Assessment Tax Assessment Total Assessment is a certain percentage of the fair market value that is determined by local assessors to be the total taxable value of land and additions on the property. | Land | Improvement |
|---|---|---|---|---|
| 2024 | $2,213 | $147,650 | $28,960 | $118,690 |
| 2023 | $2,213 | $147,650 | $28,960 | $118,690 |
| 2022 | $2,236 | $51,678 | $10,136 | $41,542 |
| 2021 | $2,011 | $43,631 | $8,281 | $35,350 |
| 2020 | $2,011 | $43,631 | $8,281 | $35,350 |
| 2019 | $2,025 | $43,631 | $8,281 | $35,350 |
| 2018 | $1,816 | $36,980 | $7,020 | $29,960 |
| 2017 | $1,816 | $36,980 | $7,020 | $29,960 |
| 2016 | $1,819 | $36,980 | $7,020 | $29,960 |
| 2014 | $1,558 | $34,470 | $7,800 | $26,670 |
| 2013 | $1,576 | $34,470 | $7,800 | $26,670 |
Source: Public Records
Map
Nearby Homes
- 118 Rear Prospect St
- 302 S Reeves Ave
- 233 E Wills Ave
- 0 Oxford St Unit 5186285
- 605 Bond St
- 629 E Wills Ave
- 1008 Union Ave NW
- 519 Sterling Ave
- 608 Patricia Ave NW
- 212 Clubside Dr NW
- 1203 4th St NW
- 210 W 4th St
- 827 Lakeview Dr
- 859 Orchard Ave NW
- 2902 Downeys Hill Dr NE
- 642 Jordan Dr NW
- 315 Lincoln Ave
- 1102 E Front St
- 3031 Downeys Hill Dr NE
- 916 Oak St NW
Your Personal Tour Guide
Ask me questions while you tour the home.