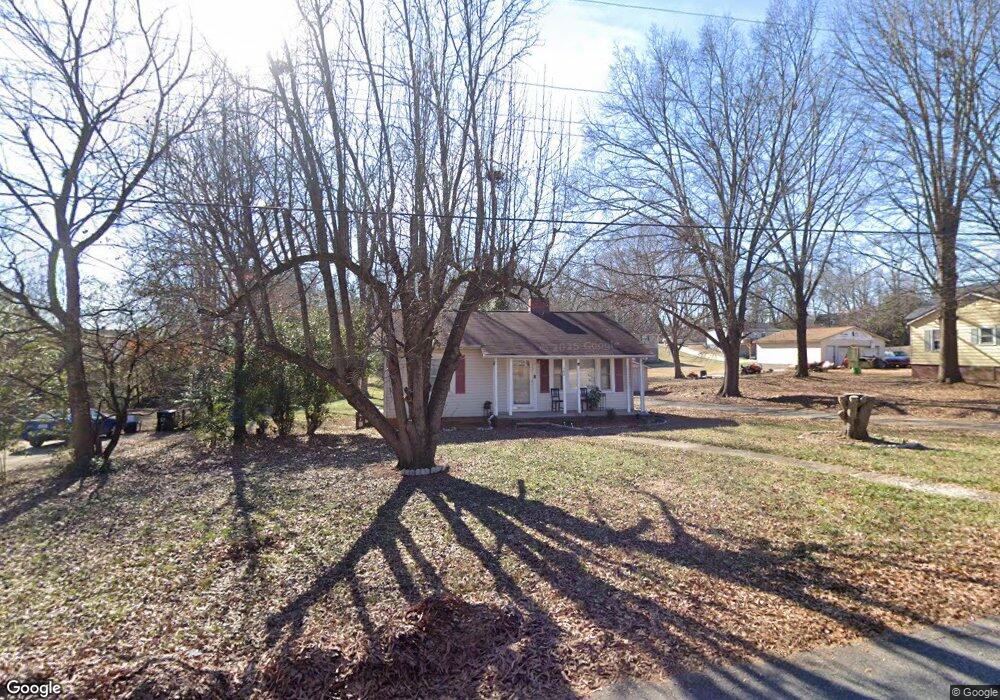
102 Eastside Dr SW Concord, NC 28027
Estimated Value: $179,000 - $246,000
2
Beds
1
Bath
986
Sq Ft
$222/Sq Ft
Est. Value
About This Home
This home is located at 102 Eastside Dr SW, Concord, NC 28027 and is currently estimated at $218,607, approximately $221 per square foot. 102 Eastside Dr SW is a home located in Cabarrus County with nearby schools including Wolf Meadow Elementary School, J.N. Fries Middle School, and Branch Christian Academy.
Ownership History
Date
Name
Owned For
Owner Type
Purchase Details
Closed on
Jan 17, 2023
Bought by
Rusagara Ange
Current Estimated Value
Purchase Details
Closed on
Oct 10, 2016
Sold by
North Carolina Housing Finance Agency
Home Financials for this Owner
Home Financials are based on the most recent Mortgage that was taken out on this home.
Original Mortgage
$60,650
Interest Rate
4.25%
Mortgage Type
Adjustable Rate Mortgage/ARM
Purchase Details
Closed on
Feb 2, 2016
Sold by
Martin Lucy M
Bought by
North Carolina Housing Finance Agency
Purchase Details
Closed on
May 21, 2004
Sold by
Dudley Richard A and Dudley Deborah R
Bought by
Martin Lucy M
Home Financials for this Owner
Home Financials are based on the most recent Mortgage that was taken out on this home.
Original Mortgage
$93,000
Interest Rate
5.77%
Mortgage Type
Purchase Money Mortgage
Purchase Details
Closed on
Jun 1, 1987
Bought by
Dudley Richard A
Purchase Details
Closed on
Aug 1, 1984
Create a Home Valuation Report for This Property
The Home Valuation Report is an in-depth analysis detailing your home's value as well as a comparison with similar homes in the area
Home Values in the Area
Average Home Value in this Area
Purchase History
| Date | Buyer | Sale Price | Title Company |
|---|---|---|---|
| Rusagara Ange | -- | -- | |
| -- | -- | None Available | |
| North Carolina Housing Finance Agency | $84,000 | None Available | |
| Martin Lucy M | $93,000 | -- | |
| Dudley Richard A | $41,500 | -- | |
| -- | $39,000 | -- |
Source: Public Records
Mortgage History
| Date | Status | Borrower | Loan Amount |
|---|---|---|---|
| Previous Owner | Namegabe Mastajabu | $60,650 | |
| Previous Owner | Martin Lucy M | $93,000 |
Source: Public Records
Tax History Compared to Growth
Tax History
| Year | Tax Paid | Tax Assessment Tax Assessment Total Assessment is a certain percentage of the fair market value that is determined by local assessors to be the total taxable value of land and additions on the property. | Land | Improvement |
|---|---|---|---|---|
| 2025 | $1,769 | $177,600 | $50,000 | $127,600 |
| 2024 | $1,769 | $177,600 | $50,000 | $127,600 |
| 2023 | $1,265 | $103,700 | $30,000 | $73,700 |
| 2022 | $1,265 | $103,700 | $30,000 | $73,700 |
| 2021 | $1,265 | $103,700 | $30,000 | $73,700 |
| 2020 | $1,265 | $103,700 | $30,000 | $73,700 |
| 2019 | $1,058 | $86,720 | $22,000 | $64,720 |
| 2018 | $1,041 | $86,720 | $22,000 | $64,720 |
| 2017 | $1,023 | $86,720 | $22,000 | $64,720 |
| 2016 | $607 | $85,230 | $22,000 | $63,230 |
| 2015 | $1,006 | $85,230 | $22,000 | $63,230 |
| 2014 | $1,006 | $85,230 | $22,000 | $63,230 |
Source: Public Records
Map
Nearby Homes
- 1255 Old Charlotte Rd
- 518 Viking Place SW
- 609 Faith Dr SW Unit 1
- 2824 Trestle Ct SW
- 668 Jackson Terrace SW
- 664 Jackson Terrace SW
- 1067 Old Charlotte Rd
- 493 Debra Cir SW
- Lot #2 Faith Dr SW
- 2893 Signal Ct SW
- 84 Highland Ave SW
- 82 Highland Ave SW
- 3168 Sossamon Place
- 809 Fargo Dr SW
- 3073 Champion Ln SW
- 782 Chalice St SW
- 933 Old Charlotte Rd
- 758 Main St SW
- 1022 Van Gogh Dr SW
- 207 Highland Ave SW
- 104 Eastside Dr SW
- 100 Eastside Dr SW
- 218 Stonecrest Cir SW
- 222 Stonecrest Cir SW
- 212 Stonecrest Cir SW
- 106 Eastside Dr SW
- 98 Eastside Dr SW
- 103 Eastside Dr SW
- 99 Eastside Dr SW
- 208 Stonecrest Cir SW
- 226 Stonecrest Cir SW
- 107 Eastside Dr SW
- 108 Eastside Dr SW
- 96 Eastside Dr SW
- 97 Eastside Dr SW
- 230 Stonecrest Cir SW
- 204 Stonecrest Cir SW
- 109 Eastside Dr SW
- 92 Stonecrest Cir SW
- 88 Stonecrest Cir SW