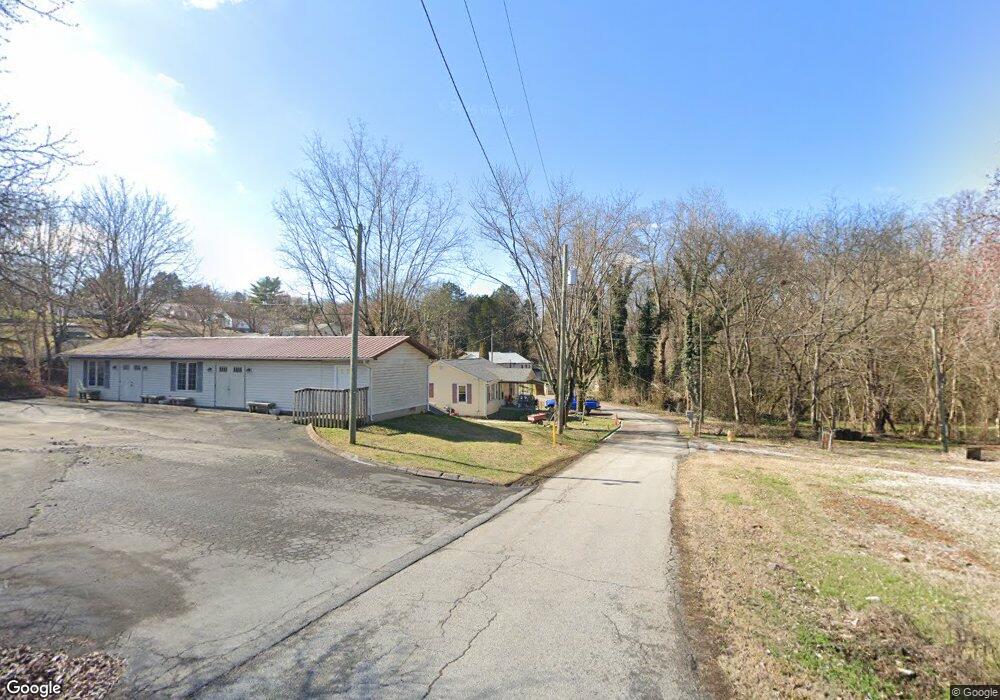
102 Eufaula Trail Loudon, TN 37774
Tellico Village NeighborhoodEstimated Value: $737,684 - $949,000
Studio
3
Baths
3,295
Sq Ft
$270/Sq Ft
Est. Value
About This Home
This home is located at 102 Eufaula Trail, Loudon, TN 37774 and is currently estimated at $891,171, approximately $270 per square foot. 102 Eufaula Trail is a home located in Loudon County with nearby schools including Loudon High School.
Ownership History
Date
Name
Owned For
Owner Type
Purchase Details
Closed on
Oct 28, 2019
Sold by
Holden Robert M and Holden Janet R
Bought by
Slonina Raymond J and Bougie Kathryn G
Current Estimated Value
Home Financials for this Owner
Home Financials are based on the most recent Mortgage that was taken out on this home.
Original Mortgage
$300,000
Outstanding Balance
$264,446
Interest Rate
3.7%
Mortgage Type
New Conventional
Estimated Equity
$626,725
Purchase Details
Closed on
Apr 6, 2018
Sold by
Holden Robert M and Holden Janet R
Bought by
Holden Robert M and Holden Janet R
Purchase Details
Closed on
May 25, 2017
Sold by
Weaver John W and Weaver Donna
Bought by
Holden Robert M and Holden Janet R
Purchase Details
Closed on
Nov 12, 2007
Sold by
Weaver Homes Co Inc
Bought by
Weaver John W
Purchase Details
Closed on
Jun 2, 2006
Sold by
Prima Properties Llc
Bought by
Weavers Homes Company Inc
Purchase Details
Closed on
Jun 17, 2005
Sold by
Loney Lawrence A
Bought by
Prima Properties Llc
Purchase Details
Closed on
Oct 11, 2002
Bought by
Loney Lawrence A and Loney Suzanne M
Create a Home Valuation Report for This Property
The Home Valuation Report is an in-depth analysis detailing your home's value as well as a comparison with similar homes in the area
Home Values in the Area
Average Home Value in this Area
Purchase History
| Date | Buyer | Sale Price | Title Company |
|---|---|---|---|
| Slonina Raymond J | $550,000 | Tellico Title Services Inc | |
| Holden Robert M | -- | None Available | |
| Holden Robert M | $490,000 | None Available | |
| Weaver John W | -- | -- | |
| Weavers Homes Company Inc | $29,000 | -- | |
| Prima Properties Llc | $11,000 | -- | |
| Loney Lawrence A | $7,000 | -- |
Source: Public Records
Mortgage History
| Date | Status | Borrower | Loan Amount |
|---|---|---|---|
| Open | Slonina Raymond J | $300,000 |
Source: Public Records
Tax History
| Year | Tax Paid | Tax Assessment Tax Assessment Total Assessment is a certain percentage of the fair market value that is determined by local assessors to be the total taxable value of land and additions on the property. | Land | Improvement |
|---|---|---|---|---|
| 2025 | $2,518 | $142,375 | $7,500 | $134,875 |
| 2024 | $2,162 | $142,375 | $7,500 | $134,875 |
| 2023 | $2,162 | $142,375 | $0 | $0 |
| 2022 | $2,162 | $142,375 | $7,500 | $134,875 |
| 2021 | $2,162 | $142,375 | $7,500 | $134,875 |
| 2020 | $2,097 | $142,375 | $7,500 | $134,875 |
| 2019 | $2,097 | $116,250 | $6,250 | $110,000 |
| 2018 | $2,097 | $116,250 | $6,250 | $110,000 |
| 2017 | $2,097 | $116,250 | $6,250 | $110,000 |
| 2016 | $2,022 | $108,775 | $7,500 | $101,275 |
| 2015 | $2,022 | $108,775 | $7,500 | $101,275 |
| 2014 | $2,022 | $108,775 | $7,500 | $101,275 |
Source: Public Records
Map
Nearby Homes
- 126 Tommotley Dr
- 204 Tuscarora Ln
- 5296 Old Club Rd
- 356 Okema Way
- 323 Okmulgee Cir
- 208 Okema Trace
- 178 Tommotley Dr
- 322 Okmulgee Cir
- 410 Catoosa Ln
- 301 Seminole
- 319 Okema Way
- 402 Catoosa Ln
- 213 Coyatee Dr
- 280 Coyatee Dr N
- 325 Tahlequah Dr
- 131 Kenosha Ln
- 204 Seminole Cir
- 433 Wewoka Cir
- 203 Seminole Cir
- 122 Kenosha Ln
- 102 Eufaula Trace
- 100 Eufaula Trace
- 104 Eufaula Trace
- 105 Eufaula Trace
- 105 Eufaula Trail
- 103 Eufaula Trail
- 110 Tommotley Dr
- 107 Tommotley Dr
- 106 Tommotley Dr
- 103 Cayuga Dr
- 105 Cayuga Dr
- 107 Cayuga Dr
- 105 Tommotley Dr
- 101 Cayuga Dr
- 104 Tommotley Dr
- 218 Chickasaw Ln
- 118 Tommotley Dr
- 216 Chickasaw Ln
- 220 Chickasaw Ln
- 117 Tommotley Dr
Your Personal Tour Guide
Ask me questions while you tour the home.