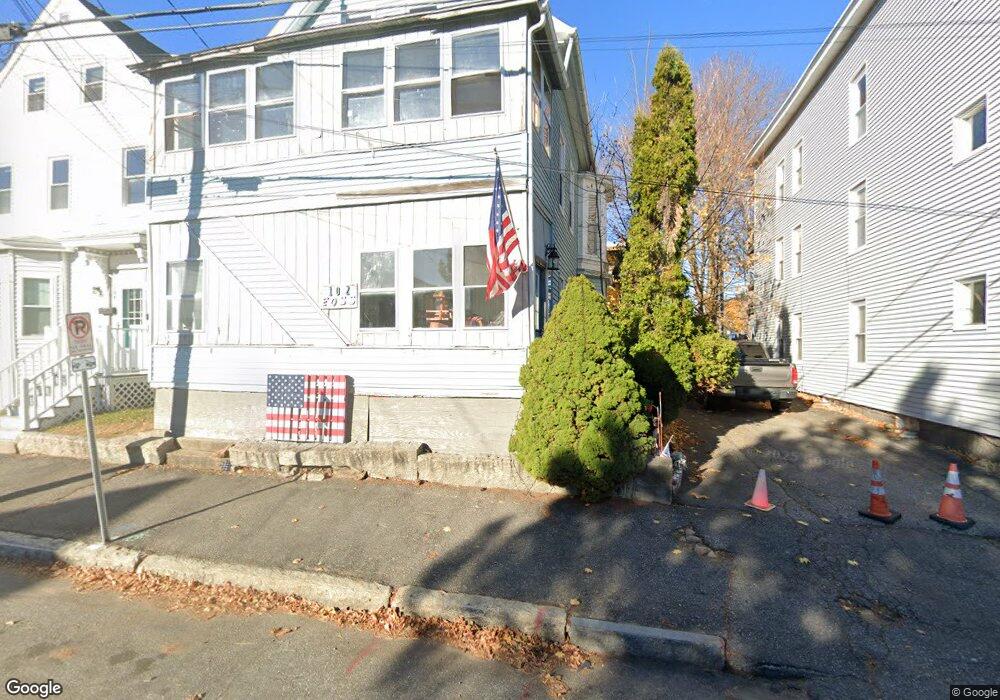
102 Foss St Biddeford, ME 04005
Downtown Biddeford NeighborhoodEstimated Value: $377,745 - $548,000
5
Beds
2
Baths
2,248
Sq Ft
$203/Sq Ft
Est. Value
About This Home
This home is located at 102 Foss St, Biddeford, ME 04005 and is currently estimated at $456,436, approximately $203 per square foot. 102 Foss St is a home located in York County with nearby schools including John F Kennedy Memorial School, Biddeford Primary School, and Biddeford Intermediate School.
Ownership History
Date
Name
Owned For
Owner Type
Purchase Details
Closed on
Apr 28, 2025
Sold by
Brown Antoinette I H Est and Brown
Bought by
Halacy Robin
Current Estimated Value
Create a Home Valuation Report for This Property
The Home Valuation Report is an in-depth analysis detailing your home's value as well as a comparison with similar homes in the area
Home Values in the Area
Average Home Value in this Area
Purchase History
| Date | Buyer | Sale Price | Title Company |
|---|---|---|---|
| Halacy Robin | -- | None Available | |
| Halacy Robin | -- | None Available | |
| Halacy Robin | -- | None Available |
Source: Public Records
Tax History Compared to Growth
Tax History
| Year | Tax Paid | Tax Assessment Tax Assessment Total Assessment is a certain percentage of the fair market value that is determined by local assessors to be the total taxable value of land and additions on the property. | Land | Improvement |
|---|---|---|---|---|
| 2024 | $3,928 | $276,200 | $122,800 | $153,400 |
| 2023 | $3,592 | $273,800 | $122,800 | $151,000 |
| 2022 | $2,834 | $172,700 | $59,400 | $113,300 |
| 2021 | $2,671 | $146,500 | $48,600 | $97,900 |
| 2020 | $2,414 | $120,400 | $37,800 | $82,600 |
| 2019 | $2,406 | $120,400 | $37,800 | $82,600 |
| 2018 | $2,372 | $120,400 | $37,800 | $82,600 |
| 2017 | $2,346 | $116,900 | $37,800 | $79,100 |
| 2016 | $2,322 | $116,900 | $37,800 | $79,100 |
| 2015 | $2,081 | $116,900 | $37,800 | $79,100 |
| 2014 | $2,030 | $116,900 | $37,800 | $79,100 |
| 2013 | -- | $165,600 | $61,500 | $104,100 |
Source: Public Records
Map
Nearby Homes
- 109 Alfred Rd
- 93 Summer St
- 99 Summer St
- 11 King St
- 155 Hill St
- 17 Granite St
- 84 Pike St
- 38 South St
- 16 Hill St
- 40 South St
- 66 Graham St
- 2 Main St Unit 17-506
- 2 Main St Unit 15-310
- 2 Main St Unit 15-403
- 2 Main St Unit 18-420
- 2 Main St Unit 15-311
- 2 Main St Unit 17-508
- 2 Main St Unit 17-414
- 2 Main St Unit 18-307
- 2 Main St Unit 17-415