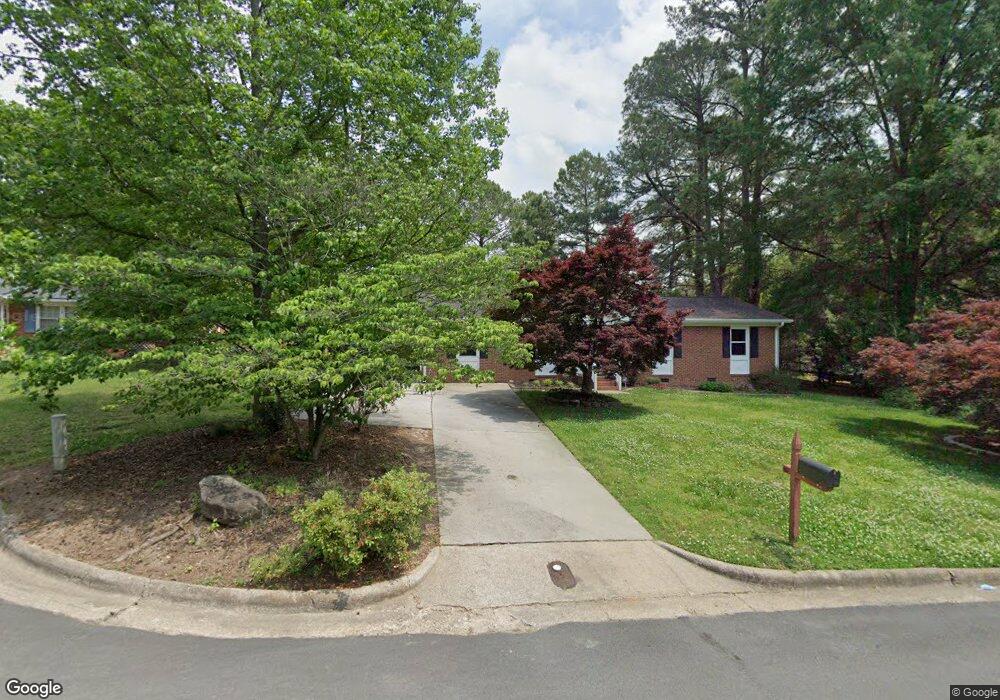
102 Glenview Ct Garner, NC 27529
Estimated Value: $290,000 - $333,000
3
Beds
2
Baths
1,442
Sq Ft
$214/Sq Ft
Est. Value
About This Home
This home is located at 102 Glenview Ct, Garner, NC 27529 and is currently estimated at $307,943, approximately $213 per square foot. 102 Glenview Ct is a home located in Wake County with nearby schools including Vandora Springs Elementary, North Garner Middle, and Garner High.
Ownership History
Date
Name
Owned For
Owner Type
Purchase Details
Closed on
May 29, 2024
Sold by
Leo J Montgomery Living Trust and Montgomery Leo James
Bought by
Kleeberger James D
Current Estimated Value
Purchase Details
Closed on
Sep 12, 2023
Sold by
Montgomery Leo James
Bought by
Leo J Montgomery Living Trust and Montgomery
Purchase Details
Closed on
Aug 18, 2006
Sold by
Britt Michael L
Bought by
Montgomery Leo J and Montgomery Connie N
Home Financials for this Owner
Home Financials are based on the most recent Mortgage that was taken out on this home.
Original Mortgage
$101,600
Interest Rate
6.5%
Mortgage Type
Purchase Money Mortgage
Purchase Details
Closed on
Jun 15, 2001
Sold by
Haywood Danny P
Bought by
Britt Michael L
Home Financials for this Owner
Home Financials are based on the most recent Mortgage that was taken out on this home.
Original Mortgage
$109,315
Interest Rate
7.11%
Mortgage Type
FHA
Create a Home Valuation Report for This Property
The Home Valuation Report is an in-depth analysis detailing your home's value as well as a comparison with similar homes in the area
Home Values in the Area
Average Home Value in this Area
Purchase History
| Date | Buyer | Sale Price | Title Company |
|---|---|---|---|
| Kleeberger James D | $320,000 | None Listed On Document | |
| Leo J Montgomery Living Trust | -- | None Listed On Document | |
| Montgomery Leo J | $127,000 | None Available | |
| Britt Michael L | $111,000 | -- |
Source: Public Records
Mortgage History
| Date | Status | Borrower | Loan Amount |
|---|---|---|---|
| Previous Owner | Montgomery Leo J | $101,600 | |
| Previous Owner | Britt Michael L | $109,315 |
Source: Public Records
Tax History
| Year | Tax Paid | Tax Assessment Tax Assessment Total Assessment is a certain percentage of the fair market value that is determined by local assessors to be the total taxable value of land and additions on the property. | Land | Improvement |
|---|---|---|---|---|
| 2025 | $3,045 | $291,675 | $120,000 | $171,675 |
| 2024 | $3,034 | $291,675 | $120,000 | $171,675 |
Source: Public Records
Map
Nearby Homes
- 507 Forest Ridge Rd
- 617 Springview Trail
- 500 Oak Reserve Dr Unit 103
- 500 Oak Reserve Dr Unit 102
- 500 Oak Reserve Dr Unit 100
- 1710 Lakeside Dr
- 1416 Old Buckhorn Rd
- 1016 Buckhorn Rd
- 1201 Poplar Ave
- 902 Vandora Ave
- 109 Hiddenwood Ct
- 1320 W Garner Rd Unit 103
- 1320 W Garner Rd Unit 100
- 1320 W Garner Rd Unit 102
- 1320 W Garner Rd Unit 101
- 500 Oak Reserve Rd Unit 103
- 500 Oak Reserve Rd Unit 102
- 500 Oak Reserve Rd Unit 100
- 5108 Old Valley St
- 0 Dupree St
- 804 Springview Trail
- 104 Glenview Ct
- 802 Springview Trail
- 103 Brookstone Ct
- 900 Springview Trail
- 105 Brookstone Ct
- 106 Glenview Ct
- 800 Springview Trail
- 103 Glenview Ct
- 105 Glenview Ct
- 1509 Foxwood Dr
- 902 Springview Trail
- 1511 Foxwood Dr
- 805 Springview Trail
- 1507 Foxwood Dr
- 901 Springview Trail
- 803 Springview Trail
- 811 Springview Trail
- 104 Brookstone Ct
- 702 Springview Trail
Your Personal Tour Guide
Ask me questions while you tour the home.