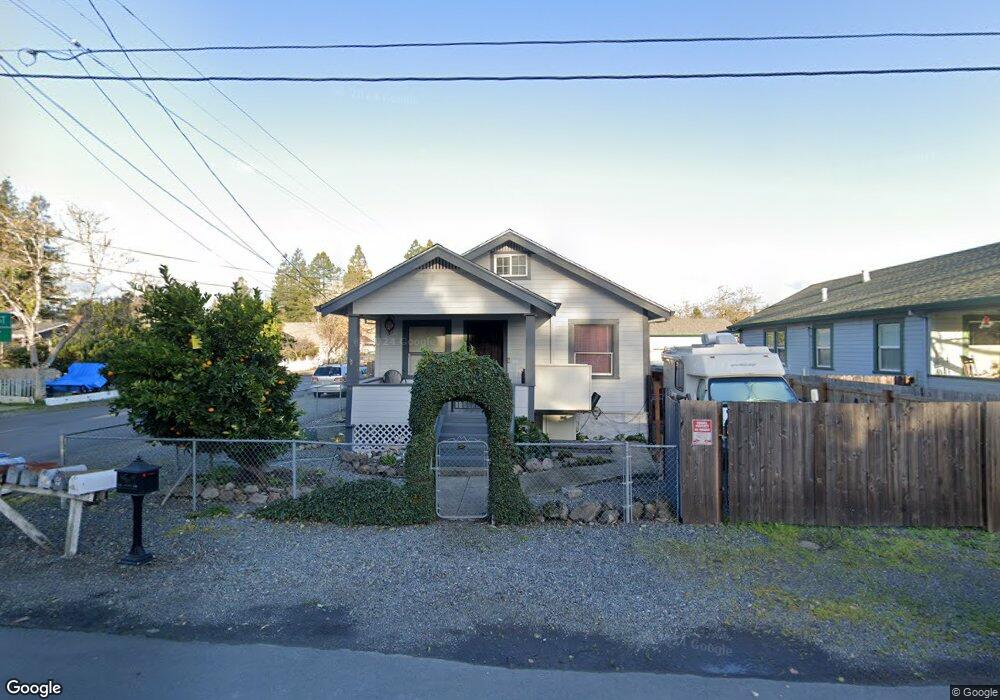
102 Hull St Santa Rosa, CA 95401
Estimated Value: $365,000 - $533,000
2
Beds
1
Bath
796
Sq Ft
$575/Sq Ft
Est. Value
About This Home
This home is located at 102 Hull St, Santa Rosa, CA 95401 and is currently estimated at $457,782, approximately $575 per square foot. 102 Hull St is a home located in Sonoma County with nearby schools including Elsie Allen High School, Kid Street Charter School, and St. Michael's Orthodox School.
Ownership History
Date
Name
Owned For
Owner Type
Purchase Details
Closed on
Jun 10, 2014
Sold by
Petty Alice D and Alice D Petty Revocable Trust
Bought by
Petty Petty Suzanne E Suzanne E and Petty Bill A
Current Estimated Value
Purchase Details
Closed on
Nov 8, 2004
Sold by
Petty Alice D
Bought by
Petty Alice D and Alice D Petty Revocable Trust
Purchase Details
Closed on
Nov 16, 1994
Sold by
Odonnell Kathleen M
Bought by
Petty Alice D and Harrell Frances
Home Financials for this Owner
Home Financials are based on the most recent Mortgage that was taken out on this home.
Original Mortgage
$90,000
Interest Rate
8.92%
Create a Home Valuation Report for This Property
The Home Valuation Report is an in-depth analysis detailing your home's value as well as a comparison with similar homes in the area
Purchase History
| Date | Buyer | Sale Price | Title Company |
|---|---|---|---|
| Petty Petty Suzanne E Suzanne E | -- | None Available | |
| Petty Alice D | -- | -- | |
| Petty Alice D | $140,000 | First American Title |
Source: Public Records
Mortgage History
| Date | Status | Borrower | Loan Amount |
|---|---|---|---|
| Closed | Petty Alice D | $90,000 |
Source: Public Records
Tax History
| Year | Tax Paid | Tax Assessment Tax Assessment Total Assessment is a certain percentage of the fair market value that is determined by local assessors to be the total taxable value of land and additions on the property. | Land | Improvement |
|---|---|---|---|---|
| 2025 | $1,646 | $235,470 | $109,326 | $126,144 |
| 2024 | $1,646 | $230,854 | $107,183 | $123,671 |
| 2023 | $1,646 | $226,329 | $105,082 | $121,247 |
| 2022 | $1,581 | $221,892 | $103,022 | $118,870 |
| 2021 | $1,648 | $217,542 | $101,002 | $116,540 |
| 2020 | $1,850 | $215,313 | $99,967 | $115,346 |
| 2019 | $1,810 | $211,092 | $98,007 | $113,085 |
| 2018 | $1,867 | $206,954 | $96,086 | $110,868 |
| 2017 | $1,772 | $202,897 | $94,202 | $108,695 |
| 2016 | $1,733 | $198,919 | $92,355 | $106,564 |
| 2015 | $1,668 | $195,932 | $90,968 | $104,964 |
| 2014 | $1,601 | $192,095 | $89,187 | $102,908 |
Source: Public Records
Map
Nearby Homes
- 158 N Dutton Ave Unit 4
- 303 Boyce St
- 107 Sebastopol Ave
- 588 Roseland Ave
- 780 Dutton Ave
- 48 Yarrow Way
- 62 Romani Ct
- 77 Romani Ct
- 1035 Maxwell Dr
- 1555 W 3rd St
- 432 8th St
- 448 Sebastopol Ave
- 930 Morgan St Unit 3
- 547 B St
- 497 Sebastopol Ave
- 595 N Dutton Ave
- 505 Palm St
- 182 Torzelli Ln
- 1127 Cleveland Ave
- 220 Carrillo St
Your Personal Tour Guide
Ask me questions while you tour the home.