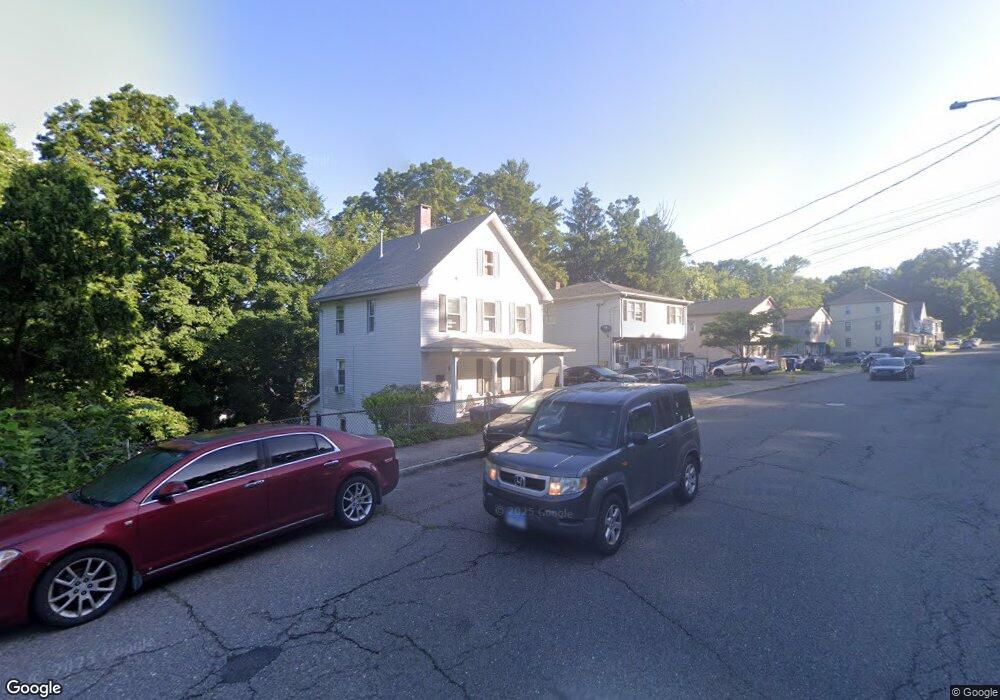
102 Jewett St Ansonia, CT 06401
Estimated Value: $189,000 - $349,000
3
Beds
2
Baths
1,248
Sq Ft
$228/Sq Ft
Est. Value
About This Home
This home is located at 102 Jewett St, Ansonia, CT 06401 and is currently estimated at $284,517, approximately $227 per square foot. 102 Jewett St is a home located in New Haven County with nearby schools including Mead School, Prendergast School, and Ansonia Middle School.
Ownership History
Date
Name
Owned For
Owner Type
Purchase Details
Closed on
Sep 24, 2009
Sold by
Lasalle Bk
Bought by
West Kevin F
Current Estimated Value
Purchase Details
Closed on
Oct 20, 2008
Sold by
Donofri Carl Taylor
Bought by
Androski Edward J
Purchase Details
Closed on
Mar 31, 2004
Sold by
Damjanovich John and Damjanovich Barbara
Bought by
Donofri Carl Taylor
Home Financials for this Owner
Home Financials are based on the most recent Mortgage that was taken out on this home.
Original Mortgage
$170,050
Interest Rate
6.85%
Purchase Details
Closed on
Mar 1, 1994
Sold by
Konapa Marianna Est
Bought by
Damjanovich John and Damjanovich Barbara
Home Financials for this Owner
Home Financials are based on the most recent Mortgage that was taken out on this home.
Original Mortgage
$70,000
Interest Rate
6.88%
Mortgage Type
Unknown
Create a Home Valuation Report for This Property
The Home Valuation Report is an in-depth analysis detailing your home's value as well as a comparison with similar homes in the area
Home Values in the Area
Average Home Value in this Area
Purchase History
| Date | Buyer | Sale Price | Title Company |
|---|---|---|---|
| West Kevin F | $91,000 | -- | |
| Androski Edward J | $196,131 | -- | |
| Donofri Carl Taylor | $179,000 | -- | |
| Damjanovich John | $95,000 | -- |
Source: Public Records
Mortgage History
| Date | Status | Borrower | Loan Amount |
|---|---|---|---|
| Previous Owner | Damjanovich John | $170,050 | |
| Previous Owner | Damjanovich John | $70,000 |
Source: Public Records
Tax History Compared to Growth
Tax History
| Year | Tax Paid | Tax Assessment Tax Assessment Total Assessment is a certain percentage of the fair market value that is determined by local assessors to be the total taxable value of land and additions on the property. | Land | Improvement |
|---|---|---|---|---|
| 2025 | $4,479 | $156,870 | $36,120 | $120,750 |
| 2024 | $4,155 | $156,870 | $36,120 | $120,750 |
| 2023 | $4,116 | $156,870 | $36,120 | $120,750 |
| 2022 | $4,109 | $108,700 | $36,100 | $72,600 |
| 2021 | $4,109 | $108,700 | $36,100 | $72,600 |
| 2020 | $4,109 | $108,700 | $36,100 | $72,600 |
| 2019 | $4,109 | $108,700 | $36,100 | $72,600 |
| 2018 | $1,564 | $108,700 | $36,100 | $72,600 |
| 2017 | $3,489 | $93,500 | $41,400 | $52,100 |
| 2016 | $3,489 | $93,500 | $41,400 | $52,100 |
| 2015 | $3,508 | $93,500 | $41,400 | $52,100 |
| 2014 | $3,610 | $93,500 | $41,400 | $52,100 |
| 2013 | $3,678 | $93,500 | $41,400 | $52,100 |
Source: Public Records
Map
Nearby Homes
- 123 Jewett St
- 20 Hodge Ave Unit 22
- 101 Platt St
- 4 N Spring St
- 21 Elm St
- 31 Cortland Place Unit 31
- 18 Vose St
- 18 New St
- 188 Prindle Ave
- 14 Nancy Rd
- 6 Crescent St
- 107A Howard Ave
- 132 Howard Ave
- 7 Howard Ave Unit 3
- 115 Atwater Ave
- 6 Grove St
- 23 Day St
- 273 Derby Ave Unit 213
- 273 Derby Ave Unit 501
- 42 Meadow St