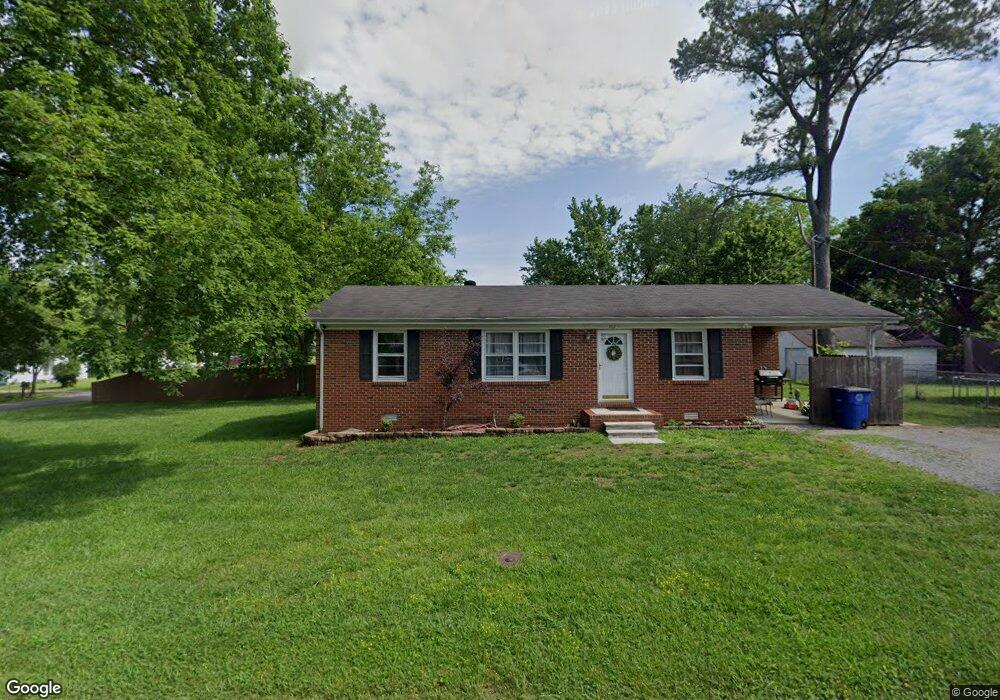
102 Kayden St Shelbyville, TN 37160
Estimated Value: $168,687 - $273,000
--
Bed
2
Baths
1,025
Sq Ft
$219/Sq Ft
Est. Value
About This Home
This home is located at 102 Kayden St, Shelbyville, TN 37160 and is currently estimated at $224,422, approximately $218 per square foot. 102 Kayden St is a home located in Bedford County with nearby schools including South Side Elementary School, Harris Middle School, and Christian Chapel Academy.
Ownership History
Date
Name
Owned For
Owner Type
Purchase Details
Closed on
Mar 5, 2008
Sold by
Baker Dillard
Bought by
Smith Jeffrey Scott
Current Estimated Value
Purchase Details
Closed on
May 17, 2004
Sold by
Oakes Christopher T
Bought by
Baker Dillard
Purchase Details
Closed on
Aug 13, 2001
Sold by
Gordon G S Bettye
Bought by
Oakes Christpher T and Oakes Cryst
Home Financials for this Owner
Home Financials are based on the most recent Mortgage that was taken out on this home.
Original Mortgage
$59,300
Interest Rate
7.18%
Purchase Details
Closed on
Mar 28, 1978
Bought by
Gordon G S
Create a Home Valuation Report for This Property
The Home Valuation Report is an in-depth analysis detailing your home's value as well as a comparison with similar homes in the area
Home Values in the Area
Average Home Value in this Area
Purchase History
| Date | Buyer | Sale Price | Title Company |
|---|---|---|---|
| Smith Jeffrey Scott | $86,000 | -- | |
| Baker Dillard | $66,000 | -- | |
| Oakes Christpher T | $61,150 | -- | |
| Gordon G S | -- | -- |
Source: Public Records
Mortgage History
| Date | Status | Borrower | Loan Amount |
|---|---|---|---|
| Previous Owner | Gordon G S | $59,300 |
Source: Public Records
Tax History Compared to Growth
Tax History
| Year | Tax Paid | Tax Assessment Tax Assessment Total Assessment is a certain percentage of the fair market value that is determined by local assessors to be the total taxable value of land and additions on the property. | Land | Improvement |
|---|---|---|---|---|
| 2025 | -- | $26,875 | $0 | $0 |
| 2024 | -- | $26,875 | $4,200 | $22,675 |
| 2023 | $1,023 | $26,875 | $4,200 | $22,675 |
| 2022 | $1,052 | $26,875 | $4,200 | $22,675 |
| 2021 | $955 | $26,875 | $4,200 | $22,675 |
| 2020 | $836 | $26,875 | $4,200 | $22,675 |
| 2019 | $836 | $18,875 | $3,250 | $15,625 |
| 2018 | $817 | $18,875 | $3,250 | $15,625 |
| 2017 | $817 | $18,875 | $3,250 | $15,625 |
| 2016 | $810 | $18,875 | $3,250 | $15,625 |
| 2015 | $810 | $18,875 | $3,250 | $15,625 |
| 2014 | $677 | $17,263 | $0 | $0 |
Source: Public Records
Map
Nearby Homes