102 Maple St Broken Bow, OK 74728
Estimated Value: $211,199 - $464,000
3
Beds
2
Baths
2,956
Sq Ft
$119/Sq Ft
Est. Value
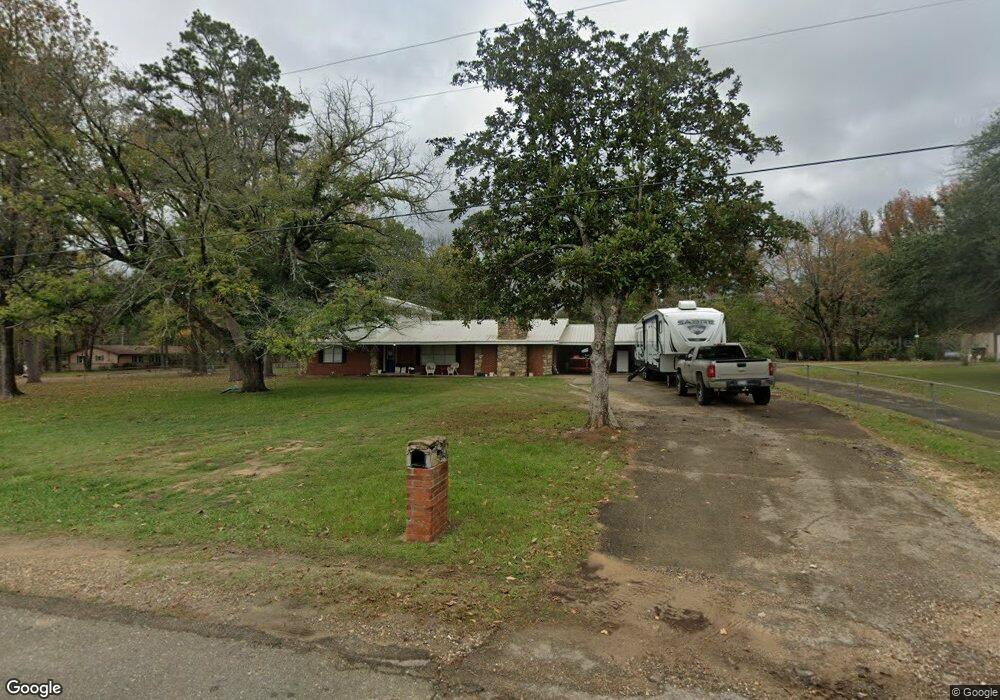
About This Home
This home is located at 102 Maple St, Broken Bow, OK 74728 and is currently estimated at $352,300, approximately $119 per square foot. 102 Maple St is a home located in McCurtain County with nearby schools including Dierks Elementary School, Bennett Elementary School, and Rector Johnson Middle School.
Ownership History
Date
Name
Owned For
Owner Type
Purchase Details
Closed on
Jul 17, 2012
Sold by
Powers Chris and Powers Sandy
Bought by
Hendricks Plesant Brandon Lee and Hendricks Jianna D
Current Estimated Value
Home Financials for this Owner
Home Financials are based on the most recent Mortgage that was taken out on this home.
Original Mortgage
$165,010
Outstanding Balance
$113,357
Interest Rate
3.72%
Mortgage Type
New Conventional
Estimated Equity
$238,943
Purchase Details
Closed on
Sep 14, 2010
Sold by
Baldwin Rozella and Baldwin Greg
Bought by
Powers Chris and Powers Sandy
Purchase Details
Closed on
Oct 3, 1997
Sold by
Baldwin Thurrell and Baldwin Rozell
Bought by
Jr Trust
Purchase Details
Closed on
Apr 30, 1997
Sold by
Patrick Grace
Bought by
Baldwin Thurrell
Create a Home Valuation Report for This Property
The Home Valuation Report is an in-depth analysis detailing your home's value as well as a comparison with similar homes in the area
Home Values in the Area
Average Home Value in this Area
Purchase History
| Date | Buyer | Sale Price | Title Company |
|---|---|---|---|
| Hendricks Plesant Brandon Lee | $157,000 | None Available | |
| Powers Chris | $65,000 | -- | |
| Jr Trust | -- | -- | |
| Baldwin Thurrell | $58,500 | -- |
Source: Public Records
Mortgage History
| Date | Status | Borrower | Loan Amount |
|---|---|---|---|
| Open | Hendricks Plesant Brandon Lee | $165,010 |
Source: Public Records
Tax History
| Year | Tax Paid | Tax Assessment Tax Assessment Total Assessment is a certain percentage of the fair market value that is determined by local assessors to be the total taxable value of land and additions on the property. | Land | Improvement |
|---|---|---|---|---|
| 2025 | $1,239 | $14,861 | $866 | $13,995 |
| 2024 | $1,180 | $14,154 | $825 | $13,329 |
| 2023 | $1,160 | $14,154 | $825 | $13,329 |
| 2022 | $1,522 | $18,560 | $825 | $17,735 |
| 2021 | $1,496 | $18,560 | $825 | $17,735 |
| 2020 | $1,549 | $19,066 | $825 | $18,241 |
| 2019 | $1,598 | $19,573 | $825 | $18,748 |
| 2018 | $1,637 | $19,826 | $825 | $19,001 |
| 2017 | $1,625 | $19,520 | $550 | $18,970 |
| 2016 | $1,559 | $18,590 | $550 | $18,040 |
| 2015 | $1,596 | $18,590 | $550 | $18,040 |
| 2014 | $1,605 | $18,590 | $550 | $18,040 |
Source: Public Records
Map
Nearby Homes
- 402 Elm St
- 908 Circle Dr
- 59 Pine St
- 742 Scrub Oak Trail
- 135 Lost Creek Trail
- 334 Bent Oak Trail
- 300 Bent Oak Trail
- 229 Sweet Gum Trail
- 299 Sugarberry Trail
- 875 N Lukfata Trail Rd
- 617 Sugarberry Trail
- 101 Mountain Pine Trail
- 44 Blue Ivy Cir
- 189 Sweet Gum Trail
- 168 Basswood Trail
- 183 Preserve Way
- 136 Preserve Way
- 112 Preserve Way
- 86 Preserve Way
- 507 N Bock St
Your Personal Tour Guide
Ask me questions while you tour the home.