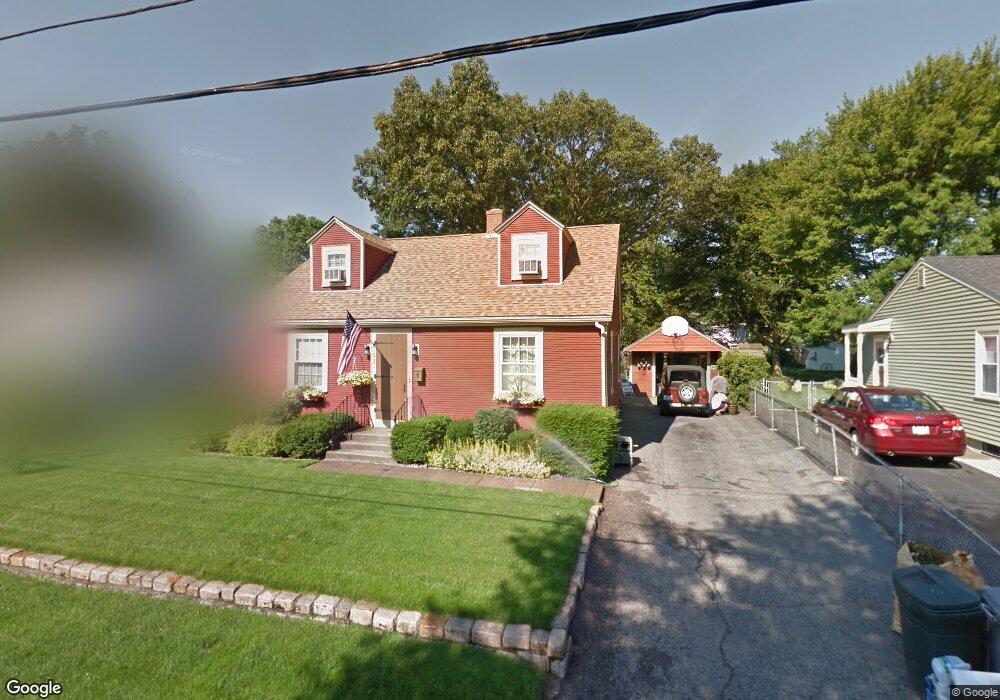
102 Maplecrest Dr Pawtucket, RI 02861
Darlington NeighborhoodEstimated Value: $396,000 - $441,000
3
Beds
1
Bath
1,305
Sq Ft
$322/Sq Ft
Est. Value
About This Home
This home is located at 102 Maplecrest Dr, Pawtucket, RI 02861 and is currently estimated at $420,173, approximately $321 per square foot. 102 Maplecrest Dr is a home located in Providence County with nearby schools including St Cecilia School and Dayspring Christian Academy.
Ownership History
Date
Name
Owned For
Owner Type
Purchase Details
Closed on
May 4, 2023
Sold by
Casavant Paul G and Casavant Linda R
Bought by
Linda R Casavant Irt and Casavant
Current Estimated Value
Purchase Details
Closed on
May 27, 1987
Bought by
Casavant Paul G and Casavant Linda R
Create a Home Valuation Report for This Property
The Home Valuation Report is an in-depth analysis detailing your home's value as well as a comparison with similar homes in the area
Home Values in the Area
Average Home Value in this Area
Purchase History
| Date | Buyer | Sale Price | Title Company |
|---|---|---|---|
| Linda R Casavant Irt | -- | None Available | |
| Casavant Paul G | -- | -- |
Source: Public Records
Mortgage History
| Date | Status | Borrower | Loan Amount |
|---|---|---|---|
| Previous Owner | Casavant Paul G | $29,200 | |
| Previous Owner | Casavant Paul G | $49,000 | |
| Previous Owner | Casavant Paul G | $40,000 | |
| Previous Owner | Casavant Paul G | $120,000 |
Source: Public Records
Tax History Compared to Growth
Tax History
| Year | Tax Paid | Tax Assessment Tax Assessment Total Assessment is a certain percentage of the fair market value that is determined by local assessors to be the total taxable value of land and additions on the property. | Land | Improvement |
|---|---|---|---|---|
| 2025 | $4,521 | $343,800 | $154,800 | $189,000 |
| 2024 | $4,242 | $343,800 | $154,800 | $189,000 |
| 2023 | $4,338 | $256,100 | $94,600 | $161,500 |
| 2022 | $4,246 | $256,100 | $94,600 | $161,500 |
| 2021 | $4,246 | $256,100 | $94,600 | $161,500 |
| 2020 | $4,422 | $211,700 | $82,400 | $129,300 |
| 2019 | $4,422 | $211,700 | $82,400 | $129,300 |
| 2018 | $4,262 | $211,700 | $82,400 | $129,300 |
| 2017 | $4,278 | $188,300 | $76,100 | $112,200 |
| 2016 | $4,122 | $188,300 | $76,100 | $112,200 |
| 2015 | $4,122 | $188,300 | $76,100 | $112,200 |
| 2014 | $3,763 | $163,200 | $63,400 | $99,800 |
Source: Public Records
Map
Nearby Homes