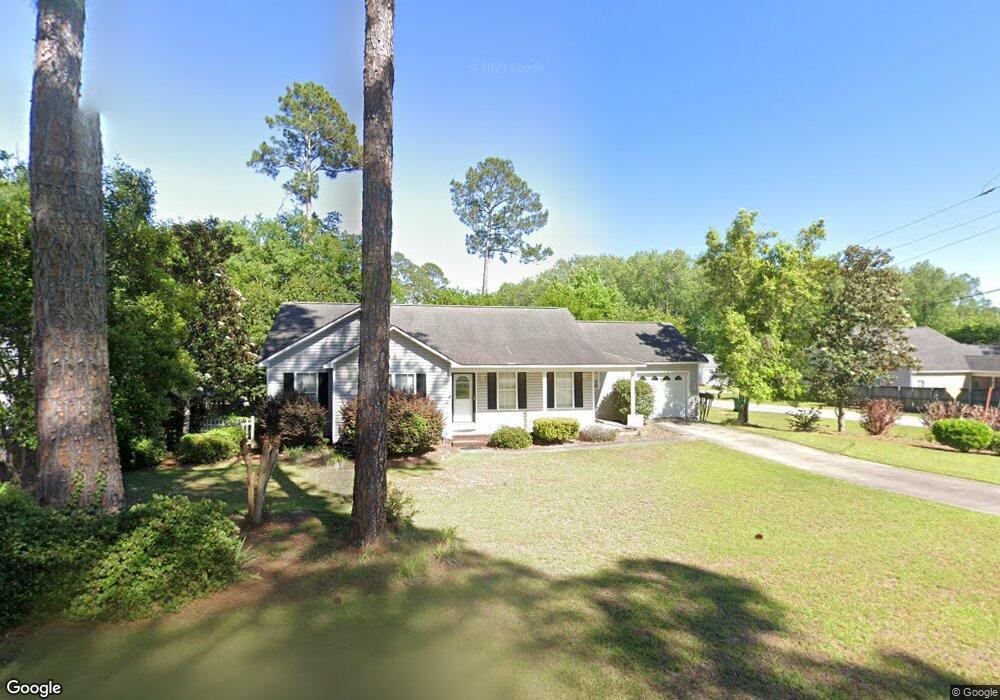
102 Maplewood Ln Sylvester, GA 31791
Estimated Value: $176,239 - $243,000
3
Beds
2
Baths
1,350
Sq Ft
$158/Sq Ft
Est. Value
About This Home
This home is located at 102 Maplewood Ln, Sylvester, GA 31791 and is currently estimated at $213,810, approximately $158 per square foot. 102 Maplewood Ln is a home located in Worth County with nearby schools including Worth County Primary School, Worth County Elementary School, and Worth County Middle School.
Ownership History
Date
Name
Owned For
Owner Type
Purchase Details
Closed on
Dec 14, 2011
Sold by
Wiggs Willie Amos
Bought by
Mckey Charlene A
Current Estimated Value
Home Financials for this Owner
Home Financials are based on the most recent Mortgage that was taken out on this home.
Original Mortgage
$104,734
Outstanding Balance
$71,817
Interest Rate
4.06%
Mortgage Type
New Conventional
Estimated Equity
$141,993
Purchase Details
Closed on
Nov 30, 2007
Sold by
Wiggs Sheila Diane
Bought by
Wiggs Willie Amos
Purchase Details
Closed on
Aug 30, 2006
Sold by
Brooks Todd
Bought by
Wiggs Willie Amos and Wiggs Sheila Diane
Home Financials for this Owner
Home Financials are based on the most recent Mortgage that was taken out on this home.
Original Mortgage
$124,000
Interest Rate
11.03%
Mortgage Type
New Conventional
Create a Home Valuation Report for This Property
The Home Valuation Report is an in-depth analysis detailing your home's value as well as a comparison with similar homes in the area
Home Values in the Area
Average Home Value in this Area
Purchase History
| Date | Buyer | Sale Price | Title Company |
|---|---|---|---|
| Mckey Charlene A | $102,640 | -- | |
| Wiggs Willie Amos | -- | -- | |
| Wiggs Willie Amos | $124,000 | -- |
Source: Public Records
Mortgage History
| Date | Status | Borrower | Loan Amount |
|---|---|---|---|
| Open | Mckey Charlene A | $104,734 | |
| Previous Owner | Wiggs Willie Amos | $124,000 |
Source: Public Records
Tax History Compared to Growth
Tax History
| Year | Tax Paid | Tax Assessment Tax Assessment Total Assessment is a certain percentage of the fair market value that is determined by local assessors to be the total taxable value of land and additions on the property. | Land | Improvement |
|---|---|---|---|---|
| 2024 | $1,634 | $44,236 | $8,000 | $36,236 |
| 2023 | $1,634 | $44,236 | $8,000 | $36,236 |
| 2022 | $1,591 | $44,236 | $8,000 | $36,236 |
| 2021 | $1,589 | $44,236 | $8,000 | $36,236 |
| 2020 | $1,591 | $44,236 | $8,000 | $36,236 |
| 2019 | $1,588 | $44,236 | $8,000 | $36,236 |
| 2018 | $1,500 | $44,236 | $8,000 | $36,236 |
| 2017 | $1,500 | $44,236 | $8,000 | $36,236 |
| 2016 | $1,588 | $44,236 | $8,000 | $36,236 |
| 2015 | $1,502 | $39,786 | $8,000 | $31,786 |
| 2014 | $1,502 | $44,236 | $8,000 | $36,236 |
| 2013 | -- | $44,236 | $8,000 | $36,236 |
| 2012 | -- | $44,235 | $8,000 | $36,235 |
Source: Public Records
Map
Nearby Homes
- 106 Rosewood Dr
- 104 Lynn Cir
- 117 Donna Dr
- 103 Dunbar Cir
- 107 Dunbar Cir
- 0 Ga Hwy 82 Unit 913408
- 402 N McPhaul St
- 203 E Pinson St
- 316 Bell Rd
- 1432 S Ga Hwy 33s
- 202 N Westberry St
- 112 Creekwood Cir
- 100 Carriage Ln
- 202A E Welch St
- 1007 N Isabella St
- 801 N Washington St
- 000 Georgia 256
- 307 E Pope St
- 1011 N Washington St
- 0 Multiple Lots Unit 138826
- 104 Maplewood Ln
- 104 Dewberry Dr
- 102 Thomas Ct
- 318 Hillside Dr
- 101 Maplewood Ln
- 106 Dewberry Dr
- 104 Thomas Ct
- 103 Maplewood Ln
- 106 Maplewood Ln
- 316 Hillside Dr
- 105 Maplewood Ln
- 106 Thomas Ct
- 101 Dewberry Dr
- 108 Maplewood Ln
- 101 Thomas Ct
- 101 Short St
- 107 Maplewood Ln
- 103 Short St
- 103 Dewberry Dr
- 102 Donna Dr