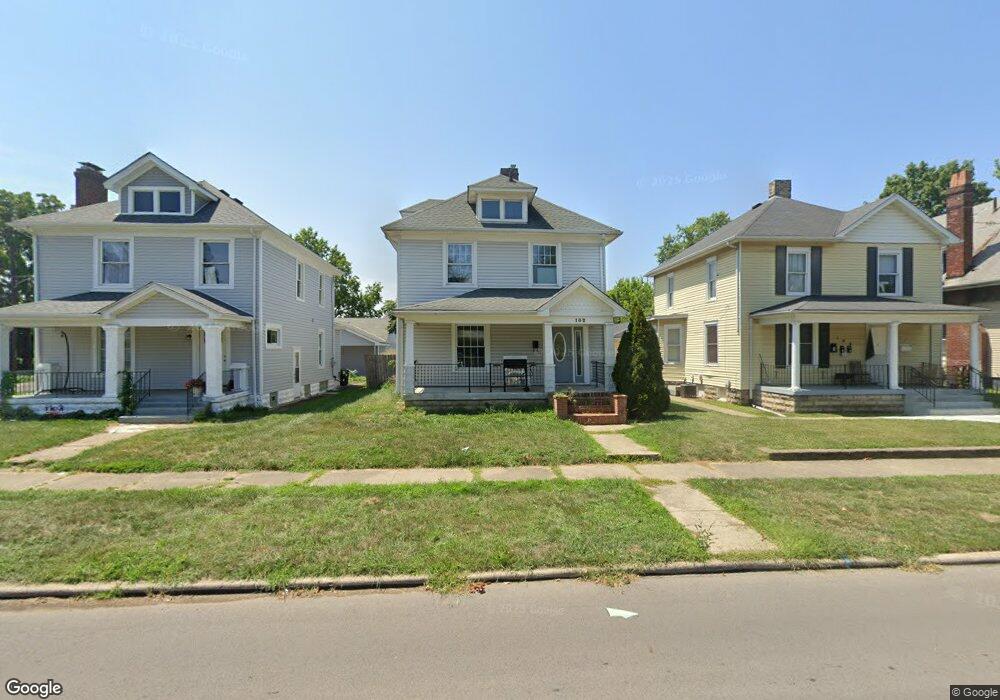
102 N Sutphin St Middletown, OH 45042
Church NeighborhoodEstimated Value: $121,000 - $149,000
4
Beds
1
Bath
1,498
Sq Ft
$93/Sq Ft
Est. Value
About This Home
This home is located at 102 N Sutphin St, Middletown, OH 45042 and is currently estimated at $138,772, approximately $92 per square foot. 102 N Sutphin St is a home located in Butler County with nearby schools including Rosa Parks Elementary School, Highview 6th Grade Center, and Middletown Middle School.
Ownership History
Date
Name
Owned For
Owner Type
Purchase Details
Closed on
Jul 17, 2007
Sold by
Household Realty Corp
Bought by
Ridener Allen W
Current Estimated Value
Purchase Details
Closed on
Mar 30, 2007
Sold by
Henry Amy L and Henry Kevin
Bought by
Household Realty Corp
Purchase Details
Closed on
Jul 16, 2002
Sold by
Federal National Mortgage Association
Bought by
Henry Amy L and Henry Amy
Home Financials for this Owner
Home Financials are based on the most recent Mortgage that was taken out on this home.
Original Mortgage
$76,794
Interest Rate
6.8%
Mortgage Type
FHA
Purchase Details
Closed on
Jan 18, 2002
Sold by
Hughes Roger P
Bought by
Federal National Mortgage Association
Purchase Details
Closed on
May 1, 1987
Create a Home Valuation Report for This Property
The Home Valuation Report is an in-depth analysis detailing your home's value as well as a comparison with similar homes in the area
Home Values in the Area
Average Home Value in this Area
Purchase History
| Date | Buyer | Sale Price | Title Company |
|---|---|---|---|
| Ridener Allen W | $54,000 | Attorney | |
| Household Realty Corp | $107,921 | Public Square Title Agency L | |
| Henry Amy L | $78,000 | -- | |
| Federal National Mortgage Association | $73,900 | -- | |
| -- | $38,000 | -- |
Source: Public Records
Mortgage History
| Date | Status | Borrower | Loan Amount |
|---|---|---|---|
| Previous Owner | Henry Amy L | $76,794 |
Source: Public Records
Tax History Compared to Growth
Tax History
| Year | Tax Paid | Tax Assessment Tax Assessment Total Assessment is a certain percentage of the fair market value that is determined by local assessors to be the total taxable value of land and additions on the property. | Land | Improvement |
|---|---|---|---|---|
| 2024 | $2,262 | $27,590 | $8,230 | $19,360 |
| 2023 | $1,453 | $27,590 | $8,230 | $19,360 |
| 2022 | $1,963 | $21,270 | $8,230 | $13,040 |
| 2021 | $1,220 | $21,270 | $8,230 | $13,040 |
| 2020 | $1,271 | $21,270 | $8,230 | $13,040 |
| 2019 | $974 | $13,440 | $4,260 | $9,180 |
| 2018 | $870 | $13,440 | $4,260 | $9,180 |
| 2017 | $872 | $13,440 | $4,260 | $9,180 |
| 2016 | $808 | $12,250 | $4,260 | $7,990 |
| 2015 | $797 | $12,250 | $4,260 | $7,990 |
| 2014 | $1,129 | $21,630 | $7,530 | $14,100 |
| 2013 | $1,129 | $18,910 | $7,530 | $11,380 |
Source: Public Records
Map
Nearby Homes
- 2007 Central Ave
- 113 N Sutphin St
- 2113 Central Ave
- 2115 Central Ave
- 206 N Sutphin St
- 2112 Central Ave
- 2119 Central Ave
- 2016 Linden Ave
- 211 Harrison St
- 6800 Fielders Way
- 19 Mckinley St
- 319 Moore St
- 1814.5 Logan Ave
- 408 Moore St
- 410 Moore St
- 2208 Superior Ave
- 1812 Carroll Ave
- 1814 Logan Ave
- 401 S Sutphin St
- 2304 Flemming Rd
- 100 N Sutphin St
- 106 N Sutphin St
- 104 N Sutphin St
- 104 N Sutphin St Unit 2
- 104 N Sutphin St Unit 3
- 108 N Sutphin St
- 20 N Sutphin St
- 110 N Sutphin St
- 109 N Sutphin St
- 103 N Sutphin St
- 105 N Sutphin St
- 101 N Sutphin St
- 18 N Sutphin St
- 21 N Sutphin St
- 111 N Sutphin St
- 16 N Sutphin St
- 112 N Sutphin St
- 1919 Manchester Ave
- 14 N Sutphin St Unit 2
- 14 N Sutphin St