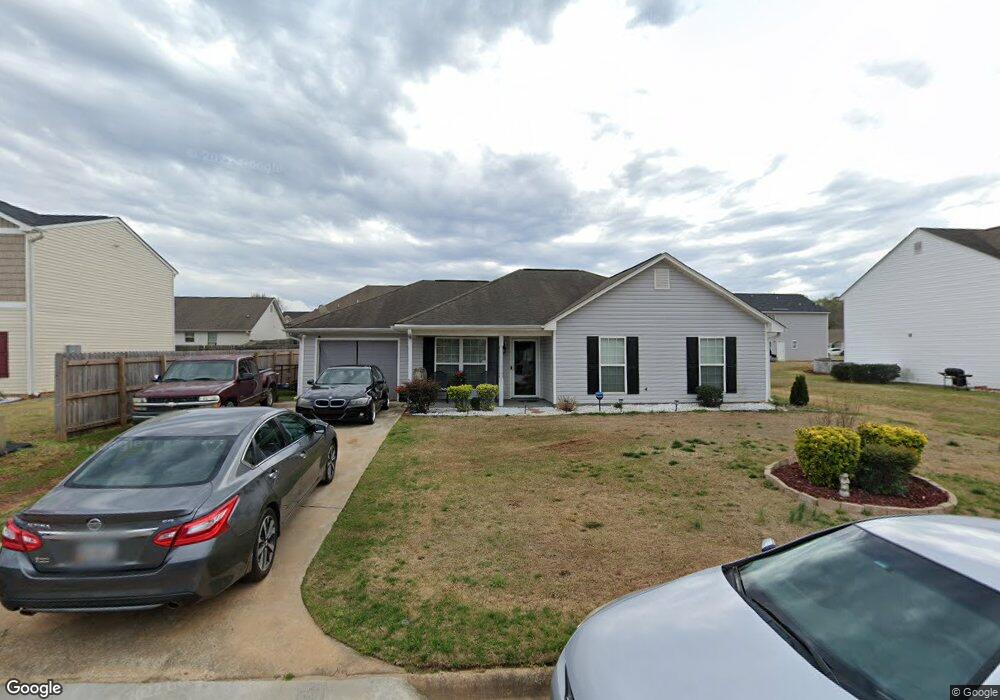
102 Olivia Way Lagrange, GA 30241
Estimated Value: $232,811 - $269,000
4
Beds
2
Baths
1,646
Sq Ft
$154/Sq Ft
Est. Value
About This Home
This home is located at 102 Olivia Way, Lagrange, GA 30241 and is currently estimated at $253,203, approximately $153 per square foot. 102 Olivia Way is a home located in Troup County with nearby schools including Callaway Elementary School, Hogansville Elementary School, and Callaway Middle School.
Ownership History
Date
Name
Owned For
Owner Type
Purchase Details
Closed on
Aug 21, 2025
Sold by
Hardy Eva D
Bought by
Evans Shakena and Hardy Eva D
Current Estimated Value
Home Financials for this Owner
Home Financials are based on the most recent Mortgage that was taken out on this home.
Original Mortgage
$96,200
Outstanding Balance
$96,117
Interest Rate
6.74%
Mortgage Type
FHA
Estimated Equity
$157,086
Purchase Details
Closed on
May 8, 2025
Sold by
Hardy Nathaniel
Bought by
Hardy Eva D
Purchase Details
Closed on
Aug 28, 2013
Sold by
Pilgrim Christopher L
Bought by
Hardy Nathaniel Lamar
Home Financials for this Owner
Home Financials are based on the most recent Mortgage that was taken out on this home.
Original Mortgage
$100,763
Interest Rate
4.37%
Mortgage Type
FHA
Purchase Details
Closed on
Jun 2, 2010
Sold by
Americas Home Place Inc
Bought by
Pilgrim Christopher L
Home Financials for this Owner
Home Financials are based on the most recent Mortgage that was taken out on this home.
Original Mortgage
$103,407
Interest Rate
5%
Mortgage Type
FHA
Purchase Details
Closed on
May 28, 2010
Sold by
Americas Home Place Inc
Bought by
Pilgrim Christopher L
Home Financials for this Owner
Home Financials are based on the most recent Mortgage that was taken out on this home.
Original Mortgage
$103,407
Interest Rate
5%
Mortgage Type
FHA
Purchase Details
Closed on
Jul 20, 2004
Sold by
Row
Bought by
Americas Home Place
Purchase Details
Closed on
Oct 1, 2001
Bought by
Row
Create a Home Valuation Report for This Property
The Home Valuation Report is an in-depth analysis detailing your home's value as well as a comparison with similar homes in the area
Purchase History
| Date | Buyer | Sale Price | Title Company |
|---|---|---|---|
| Evans Shakena | -- | -- | |
| Hardy Eva D | -- | -- | |
| Hardy Nathaniel Lamar | $109,000 | -- | |
| Pilgrim Christopher L | $104,800 | -- | |
| Pilgrim Christopher L | $104,800 | -- | |
| Americas Home Place | -- | -- | |
| Row | -- | -- |
Source: Public Records
Mortgage History
| Date | Status | Borrower | Loan Amount |
|---|---|---|---|
| Open | Evans Shakena | $96,200 | |
| Previous Owner | Hardy Nathaniel Lamar | $100,763 | |
| Previous Owner | Pilgrim Christopher L | $103,407 | |
| Previous Owner | Pilgrim Christopher L | $103,407 |
Source: Public Records
Tax History
| Year | Tax Paid | Tax Assessment Tax Assessment Total Assessment is a certain percentage of the fair market value that is determined by local assessors to be the total taxable value of land and additions on the property. | Land | Improvement |
|---|---|---|---|---|
| 2025 | $2,351 | $86,200 | $10,000 | $76,200 |
| 2024 | $1,847 | $67,720 | $10,000 | $57,720 |
| 2023 | $1,834 | $67,240 | $10,000 | $57,240 |
| 2022 | $1,766 | $63,280 | $10,000 | $53,280 |
| 2021 | $1,691 | $56,080 | $10,000 | $46,080 |
| 2020 | $1,571 | $52,080 | $6,000 | $46,080 |
| 2019 | $1,555 | $51,560 | $6,000 | $45,560 |
| 2018 | $1,473 | $48,840 | $6,000 | $42,840 |
| 2017 | $1,473 | $48,840 | $6,000 | $42,840 |
| 2016 | $1,431 | $47,449 | $6,000 | $41,449 |
| 2015 | $1,397 | $46,254 | $6,000 | $40,254 |
| 2014 | $1,319 | $43,600 | $5,927 | $37,673 |
| 2013 | -- | $40,454 | $6,000 | $34,454 |
Source: Public Records
Map
Nearby Homes
- 101 Sarah Ln
- 412 Sweetwood Ct Unit A36
- 109 Sarah Ln
- 304 Bridgette Blvd
- 0 N Barnard Ave
- 107 N Barnard Ave
- 110 Lenox Cir
- 115 Clara Jean Ct
- 5 Gulfstream Dr
- 3 Gulfstream Dr
- 509 Youngs Mill Rd
- 146 Shenandoah Ln
- 212 Cleveland Dr
- 105 Ridgefield Dr
- 142 Shenandoah Ln
- 147 Shenandoah Ln
- 204 Cleveland Dr
- 143 Shenandoah Ln
- 141 Shenandoah Ln
- 136 Shenandoah Ln
- 102 Olivia Way Unit 94
- 104 Olivia Way Unit 93
- 100 Olivia Way
- 105 Sarah Ln
- 103 Sarah Ln
- 107 Sarah Ln
- 101 Olivia Way
- 106 Olivia Way
- 103 Olivia Way
- 103 Olivia Way Unit 97
- 109 Sarah Jane Ln
- 219 River Meadow Dr
- 231 River Meadow Dr
- 210 River Meadow Dr
- 228 River Meadow Dr
- 227 River Meadow Dr Unit LOT H14
- 226 River Meadow Dr
- 218 River Meadow Dr Unit G38
- 229 River Meadow Dr
- 211 River Meadow Dr
Your Personal Tour Guide
Ask me questions while you tour the home.