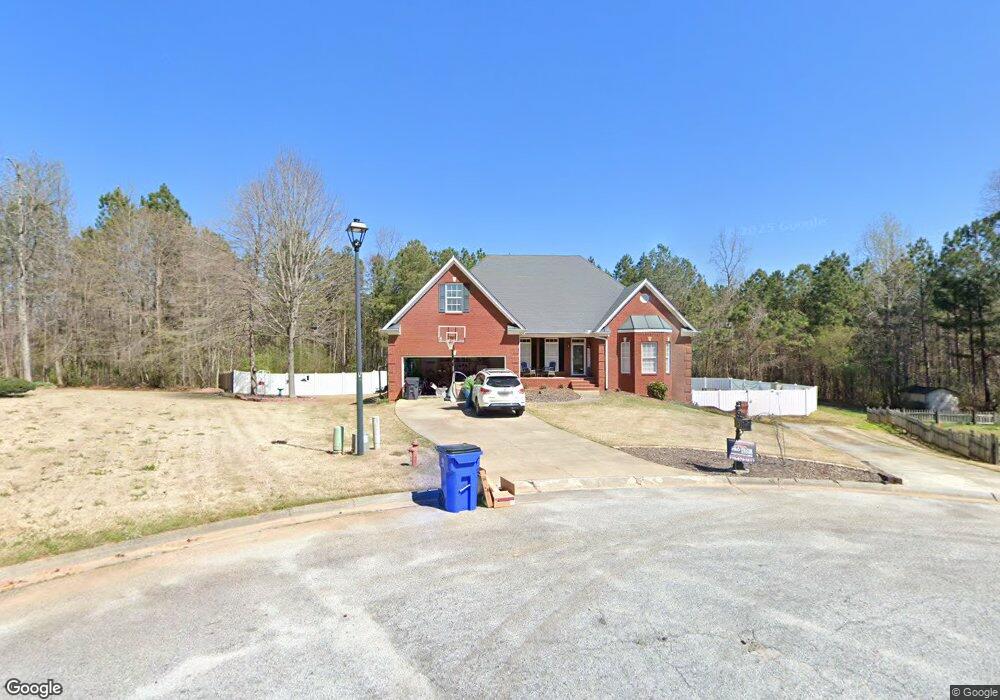
102 Pinebrook Cir Bremen, GA 30110
Estimated Value: $469,000 - $537,000
3
Beds
3
Baths
3,962
Sq Ft
$123/Sq Ft
Est. Value
About This Home
This home is located at 102 Pinebrook Cir, Bremen, GA 30110 and is currently estimated at $487,262, approximately $122 per square foot. 102 Pinebrook Cir is a home located in Haralson County with nearby schools including Jones Elementary School, Bremen 4th & 5th Grade Academy, and Bremen Middle School.
Ownership History
Date
Name
Owned For
Owner Type
Purchase Details
Closed on
Apr 22, 2016
Sold by
Kent Harry W
Bought by
Mcgee Don O and Mcgee Annette
Current Estimated Value
Home Financials for this Owner
Home Financials are based on the most recent Mortgage that was taken out on this home.
Original Mortgage
$262,500
Outstanding Balance
$208,745
Interest Rate
3.71%
Mortgage Type
VA
Estimated Equity
$278,517
Purchase Details
Closed on
May 14, 2003
Sold by
Rogers James D and Rogers Others D
Bought by
Kent Harry W and Kent Amanda L
Purchase Details
Closed on
Dec 30, 2002
Sold by
Rogers James D Jr Smith Todd Edward and Rogers James D Jr C
Bought by
Kent Harry W % and Kent Amanda L
Purchase Details
Closed on
Jun 11, 2002
Sold by
Jmt Construction Llc
Bought by
Rogers James D Jr Smith Todd Edwar
Purchase Details
Closed on
Aug 20, 2001
Sold by
C & J Development Llc
Bought by
Jmt Construction Llc
Purchase Details
Closed on
Nov 10, 2000
Sold by
Cartwright John H and Cartwright James C
Bought by
C & J Development Llc
Create a Home Valuation Report for This Property
The Home Valuation Report is an in-depth analysis detailing your home's value as well as a comparison with similar homes in the area
Home Values in the Area
Average Home Value in this Area
Purchase History
| Date | Buyer | Sale Price | Title Company |
|---|---|---|---|
| Mcgee Don O | $262,500 | -- | |
| Kent Harry W | -- | -- | |
| Kent Harry W % | $190,500 | -- | |
| Rogers James D Jr Smith Todd Edwar | -- | -- | |
| Jmt Construction Llc | $20,000 | -- | |
| C & J Development Llc | -- | -- |
Source: Public Records
Mortgage History
| Date | Status | Borrower | Loan Amount |
|---|---|---|---|
| Open | Mcgee Don O | $262,500 |
Source: Public Records
Tax History Compared to Growth
Tax History
| Year | Tax Paid | Tax Assessment Tax Assessment Total Assessment is a certain percentage of the fair market value that is determined by local assessors to be the total taxable value of land and additions on the property. | Land | Improvement |
|---|---|---|---|---|
| 2024 | $1,107 | $156,426 | $10,000 | $146,426 |
| 2023 | $1,765 | $168,696 | $10,000 | $158,696 |
| 2022 | $1,116 | $123,706 | $10,000 | $113,706 |
| 2021 | $1,110 | $117,935 | $10,000 | $107,935 |
| 2020 | $1,097 | $116,084 | $10,000 | $106,084 |
| 2019 | $1,051 | $108,107 | $10,000 | $98,107 |
| 2018 | $1,065 | $108,107 | $10,000 | $98,107 |
| 2017 | $1,178 | $101,513 | $10,000 | $91,513 |
| 2016 | $1,088 | $89,617 | $10,000 | $79,617 |
| 2015 | $1,096 | $89,876 | $10,000 | $79,877 |
| 2014 | $1,138 | $87,255 | $8,800 | $78,455 |
Source: Public Records
Map
Nearby Homes
- 12 C W Smith Cir
- 113 Watson Dr
- 80 C W Smith Cir
- 193 Meadow Creek Cir
- 282 Sanders Rd
- 0 Waterford Rd Unit 10461017
- 532 Mcpherson St
- 417 Georgia Ave N
- 317 Lakeview Dr
- 0 Shedd Rd Unit 148214
- 0 Shedd Rd Unit 7648100
- 0 Shedd Rd Unit 36.09 ACRES 10602487
- 107 Marchman St
- 1045 Highway 27 N
- 0 Cambridge Ln Unit 147921
- 0 Cambridge Ln Unit 7606605
- 0 Cambridge Ln Unit 10553817
- 111 Bryan St W
- 1121 Highway 27 N
- 195 Charleston Ave
- 103 Pinebrook Cir
- 0 Pinebrook Cir Unit 7335320
- 0 Pinebrook Cir Unit 7318410
- 0 Pinebrook Cir Unit 3226629
- 0 Pinebrook Cir
- 197 Charleston Ave
- 101 Pinebrook Cir
- 194 Charleston Ave
- 191 Charleston Ave
- 199 Charleston Ave
- 196 Charleston Ave
- 192 Charleston Ave
- 201 Charleston Ave
- 206 Watson Dr
- 198 Charleston Ave
- 189 Charleston Ave
- 529 Wilson Ave
- 190 Charleston Ave
- 533 Wilson Ave