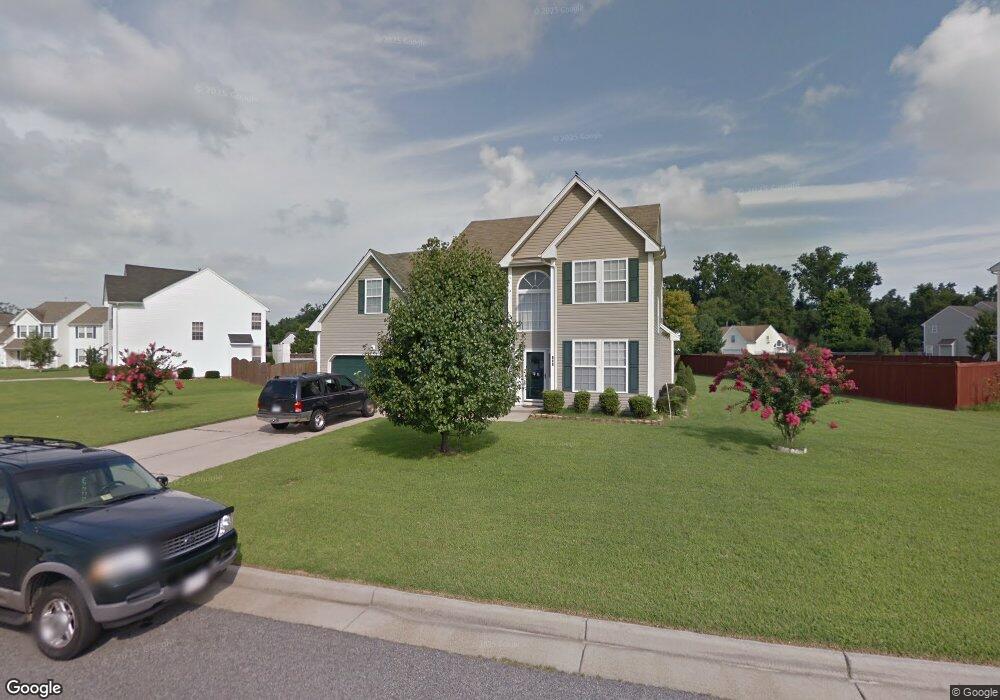
102 Quail Run Ct Suffolk, VA 23434
Cyprus NeighborhoodEstimated Value: $431,000 - $443,000
4
Beds
3
Baths
2,318
Sq Ft
$188/Sq Ft
Est. Value
About This Home
This home is located at 102 Quail Run Ct, Suffolk, VA 23434 and is currently estimated at $435,583, approximately $187 per square foot. 102 Quail Run Ct is a home located in Suffolk City with nearby schools including Nansemond Parkway Elementary School, John F. Kennedy Middle School, and King's Fork High School.
Ownership History
Date
Name
Owned For
Owner Type
Purchase Details
Closed on
Oct 20, 2023
Sold by
Abboud Gregory M
Bought by
Abboud Gregory M and Abboud Jennifer
Current Estimated Value
Purchase Details
Closed on
Feb 21, 2019
Sold by
Abboud Gregory M and Abboud Abigail
Bought by
Abboud Gregory M
Purchase Details
Closed on
Apr 9, 2014
Sold by
D And B Properties Inc
Bought by
Abboud Gregory M
Home Financials for this Owner
Home Financials are based on the most recent Mortgage that was taken out on this home.
Original Mortgage
$273,745
Interest Rate
4.37%
Mortgage Type
VA
Purchase Details
Closed on
Oct 29, 2013
Sold by
Wittstadt Title And Ecrow
Bought by
D And B Properties Inc
Home Financials for this Owner
Home Financials are based on the most recent Mortgage that was taken out on this home.
Original Mortgage
$152,777
Interest Rate
4.56%
Mortgage Type
Land Contract Argmt. Of Sale
Create a Home Valuation Report for This Property
The Home Valuation Report is an in-depth analysis detailing your home's value as well as a comparison with similar homes in the area
Home Values in the Area
Average Home Value in this Area
Purchase History
| Date | Buyer | Sale Price | Title Company |
|---|---|---|---|
| Abboud Gregory M | -- | None Listed On Document | |
| Abboud Gregory M | -- | None Available | |
| Abboud Gregory M | $265,000 | -- | |
| D And B Properties Inc | $149,737 | -- |
Source: Public Records
Mortgage History
| Date | Status | Borrower | Loan Amount |
|---|---|---|---|
| Previous Owner | D And B Properties Inc | $273,745 | |
| Previous Owner | D And B Properties Inc | $152,777 |
Source: Public Records
Tax History Compared to Growth
Tax History
| Year | Tax Paid | Tax Assessment Tax Assessment Total Assessment is a certain percentage of the fair market value that is determined by local assessors to be the total taxable value of land and additions on the property. | Land | Improvement |
|---|---|---|---|---|
| 2024 | $393 | $385,800 | $85,000 | $300,800 |
| 2023 | $393 | $393,400 | $85,000 | $308,400 |
| 2022 | $3,738 | $342,900 | $85,000 | $257,900 |
| 2021 | $3,353 | $302,100 | $73,300 | $228,800 |
| 2020 | $3,146 | $283,400 | $73,300 | $210,100 |
| 2019 | $2,991 | $269,500 | $73,300 | $196,200 |
| 2018 | $2,971 | $270,600 | $73,300 | $197,300 |
| 2017 | $2,819 | $263,500 | $73,300 | $190,200 |
| 2016 | $2,743 | $256,400 | $73,300 | $183,100 |
| 2015 | $1,424 | $249,300 | $73,300 | $176,000 |
| 2014 | $1,424 | $249,300 | $73,300 | $176,000 |
Source: Public Records
Map
Nearby Homes
- 103 Woodlake Terrace
- 2076 Nansemond Pkwy
- -1/4AC Nansemond Pkwy
- -1/4AC Nansemond Pkwy
- 2040 Nansemond Pkwy
- 2200 Wilroy Rd
- 1861 Nansemond Pkwy
- 2772 Nansemond Pkwy
- 2774 Nansemond Pkwy
- 1612 Nansemond Pkwy
- 255 Veterans Ct
- 1413 Mill Point Ct
- 1521 Olde Mill Creek Dr
- 102 Corcoran Ln
- 100 Corcoran Ln
- 1787 Mill Wood Way
- 1786 Mill Wood Way
- 109 Jaclyn Dr
- 124 Corcoran Ln
- 2570 River Watch Dr
- 100 Quail Run Ct
- 104 Quail Run Ct
- 225 Holbrook Arch
- 201 Doe Run Ct
- 227 Holbrook Arch
- 105 Quail Run Ct
- 221 Holbrook Arch
- 106 Quail Run Ct
- 101 Coral Ct
- 100 Coral Ct
- 203 Doe Run Ct
- 229 Holbrook Arch
- 107 Quail Run Ct
- 109 Quail Run Ct
- 226 Holbrook Arch
- 219 Holbrook Arch
- 202 Doe Run Ct
- 231 Holbrook Arch
- 228 Holbrook Arch
- 205 Doe Run Ct