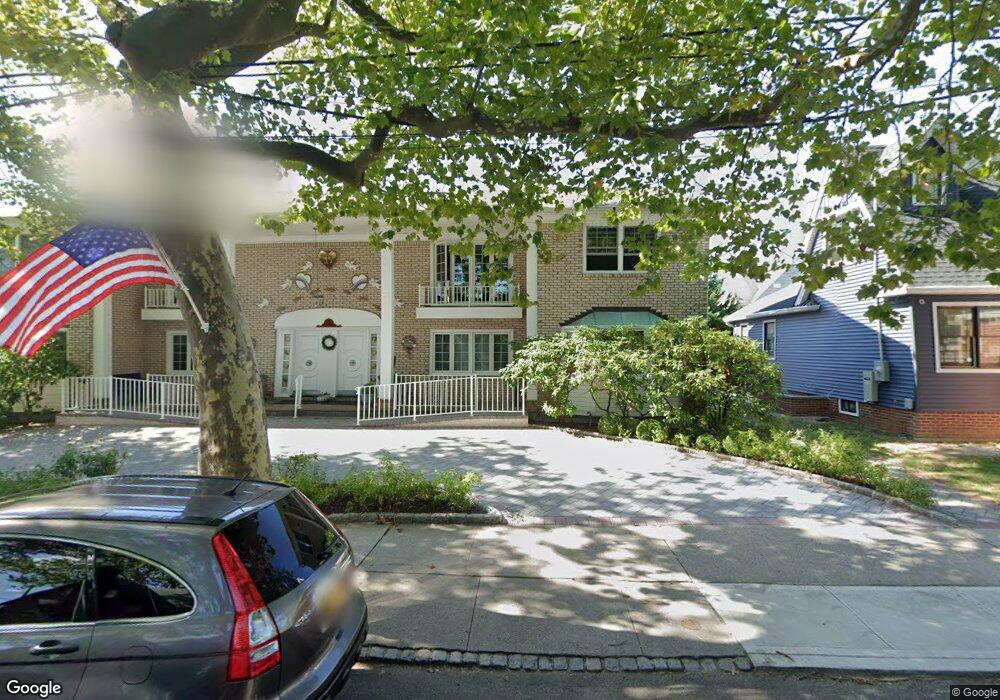
102 Rose Ave Staten Island, NY 10306
New Dorp NeighborhoodEstimated Value: $762,252 - $1,101,000
--
Bed
--
Bath
2,070
Sq Ft
$457/Sq Ft
Est. Value
About This Home
This home is located at 102 Rose Ave, Staten Island, NY 10306 and is currently estimated at $946,813, approximately $457 per square foot. 102 Rose Ave is a home located in Richmond County with nearby schools including P.S. 41 The Stephanie a Vierno School, Is 2 George L Egbert, and New Dorp High School.
Ownership History
Date
Name
Owned For
Owner Type
Purchase Details
Closed on
Aug 8, 2017
Sold by
Jb Challenge Llc
Bought by
Weeman Jeanne
Current Estimated Value
Purchase Details
Closed on
Nov 17, 2014
Sold by
Weeman Jeanne
Bought by
Jb Challenge Llc
Purchase Details
Closed on
Dec 18, 1999
Sold by
Weeman Robert W and Weeman Jeanne
Bought by
Weeman Jeanne
Create a Home Valuation Report for This Property
The Home Valuation Report is an in-depth analysis detailing your home's value as well as a comparison with similar homes in the area
Home Values in the Area
Average Home Value in this Area
Purchase History
| Date | Buyer | Sale Price | Title Company |
|---|---|---|---|
| Weeman Jeanne | -- | None Available | |
| Jb Challenge Llc | -- | None Available | |
| Weeman Jeanne | -- | Commonwealth Land Title Ins |
Source: Public Records
Tax History Compared to Growth
Tax History
| Year | Tax Paid | Tax Assessment Tax Assessment Total Assessment is a certain percentage of the fair market value that is determined by local assessors to be the total taxable value of land and additions on the property. | Land | Improvement |
|---|---|---|---|---|
| 2025 | $8,330 | $45,360 | $10,478 | $34,882 |
| 2024 | $8,330 | $48,420 | $9,816 | $38,604 |
| 2023 | $8,212 | $40,435 | $8,468 | $31,967 |
| 2022 | $7,752 | $45,720 | $11,460 | $34,260 |
| 2021 | $7,710 | $43,500 | $11,460 | $32,040 |
| 2020 | $7,315 | $39,960 | $11,460 | $28,500 |
| 2019 | $7,230 | $38,880 | $11,460 | $27,420 |
| 2018 | $6,869 | $33,696 | $8,889 | $24,807 |
| 2017 | $6,596 | $32,359 | $11,340 | $21,019 |
| 2016 | $6,103 | $30,528 | $10,798 | $19,730 |
| 2015 | $5,527 | $28,800 | $9,540 | $19,260 |
| 2014 | $5,527 | $28,800 | $9,540 | $19,260 |
Source: Public Records
Map
Nearby Homes
- 25 4th St
- 35 4 St
- 80 1st St
- 78 Cloister Place
- 129 New Dorp Plaza N
- 2419 Richmond Rd
- 79 Cloister Place
- 2390 Richmond Rd
- 24 Saint Stephens Place
- 14 Walnut Place
- 20 8 St
- 77 Burbank Ave
- 109 Saint Stephens Place
- 109 8th St
- 25 Grace Rd
- 32 Otis Ave
- 103 E 10th St Unit 3C
- 109 10th St
- 164 Burbank Ave
- 93 Beacon Ave