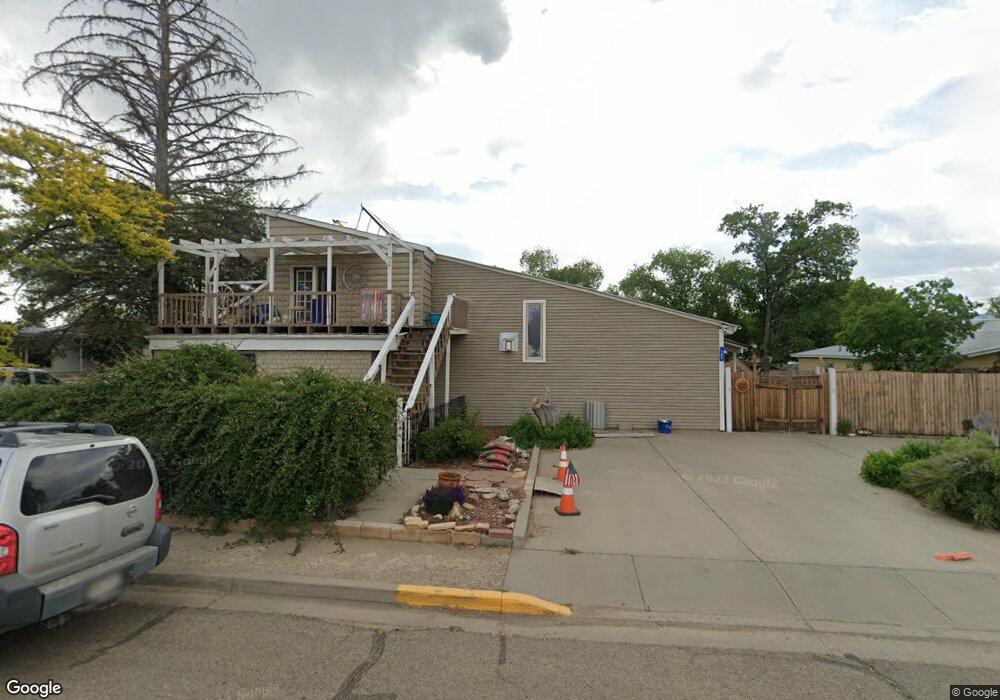
102 S Maple St Cortez, CO 81321
Estimated Value: $546,667
5
Beds
6
Baths
3,891
Sq Ft
$140/Sq Ft
Est. Value
About This Home
This home is located at 102 S Maple St, Cortez, CO 81321 and is currently priced at $546,667, approximately $140 per square foot. 102 S Maple St is a home located in Montezuma County with nearby schools including Montezuma-Cortez High School, Children's Kiva Montessori School, and Children's Kiva Montessori Preschool & Kindergarten.
Ownership History
Date
Name
Owned For
Owner Type
Purchase Details
Closed on
Jul 6, 2010
Sold by
Cullington Dennis E and Cullington Barbara J
Bought by
Cullington Barbara J
Current Estimated Value
Purchase Details
Closed on
Jul 12, 2007
Sold by
Cullington Dennis E
Bought by
Cullington Dennis E and Cullington Barbara J
Home Financials for this Owner
Home Financials are based on the most recent Mortgage that was taken out on this home.
Original Mortgage
$234,400
Outstanding Balance
$145,818
Interest Rate
6.41%
Mortgage Type
New Conventional
Purchase Details
Closed on
Jan 16, 2003
Sold by
Federal Home Loan Mortgage Corporation
Bought by
Cullington Dennis E
Purchase Details
Closed on
Sep 17, 2002
Sold by
Fahsholtz S. Roy and Wynn Nona
Bought by
Federal Home Loan Mortgage Corporation
Create a Home Valuation Report for This Property
The Home Valuation Report is an in-depth analysis detailing your home's value as well as a comparison with similar homes in the area
Home Values in the Area
Average Home Value in this Area
Purchase History
| Date | Buyer | Sale Price | Title Company |
|---|---|---|---|
| Cullington Barbara J | -- | None Available | |
| Cullington Dennis E | -- | None Available | |
| Cullington Dennis E | $120,000 | -- | |
| -- | -- | -- | |
| Federal Home Loan Mortgage Corporation | -- | -- |
Source: Public Records
Mortgage History
| Date | Status | Borrower | Loan Amount |
|---|---|---|---|
| Open | Cullington Dennis E | $234,400 |
Source: Public Records
Tax History Compared to Growth
Tax History
| Year | Tax Paid | Tax Assessment Tax Assessment Total Assessment is a certain percentage of the fair market value that is determined by local assessors to be the total taxable value of land and additions on the property. | Land | Improvement |
|---|---|---|---|---|
| 2024 | $1,788 | $34,788 | $4,397 | $30,391 |
| 2023 | $1,627 | $39,167 | $4,951 | $34,216 |
| 2022 | $1,398 | $28,929 | $2,261 | $26,668 |
| 2021 | $1,423 | $28,929 | $2,261 | $26,668 |
| 2020 | $1,323 | $27,940 | $2,487 | $25,453 |
| 2019 | $1,326 | $27,940 | $2,487 | $25,453 |
| 2018 | $1,344 | $21,080 | $2,250 | $18,830 |
| 2017 | $1,337 | $21,080 | $2,250 | $18,830 |
| 2016 | $1,408 | $24,510 | $2,490 | $22,020 |
| 2015 | $1,293 | $360,250 | $0 | $0 |
| 2014 | $1,519 | $24,740 | $0 | $0 |
Source: Public Records
Map
Nearby Homes
- 115 S Linden St
- 420 W 4th St
- 417 S Oak St
- 235 N Chestnut St Unit 6
- 410 W 6th St Unit 1
- 23 E Montezuma Ave
- 240 N Elm St
- 122 E 1st St Unit see broker remarks
- Tract 9 N Broadway
- 313 S Broadway
- 500 S Market St
- 409 N Broadway
- 102 E Montezuma Ave
- 519 S Beech St
- 306 S Ash St
- 201 S Washington St
- 210 W Coronado Ave
- 526 Juniper Place
- 530 Juniper Place
- 609 S Beech St