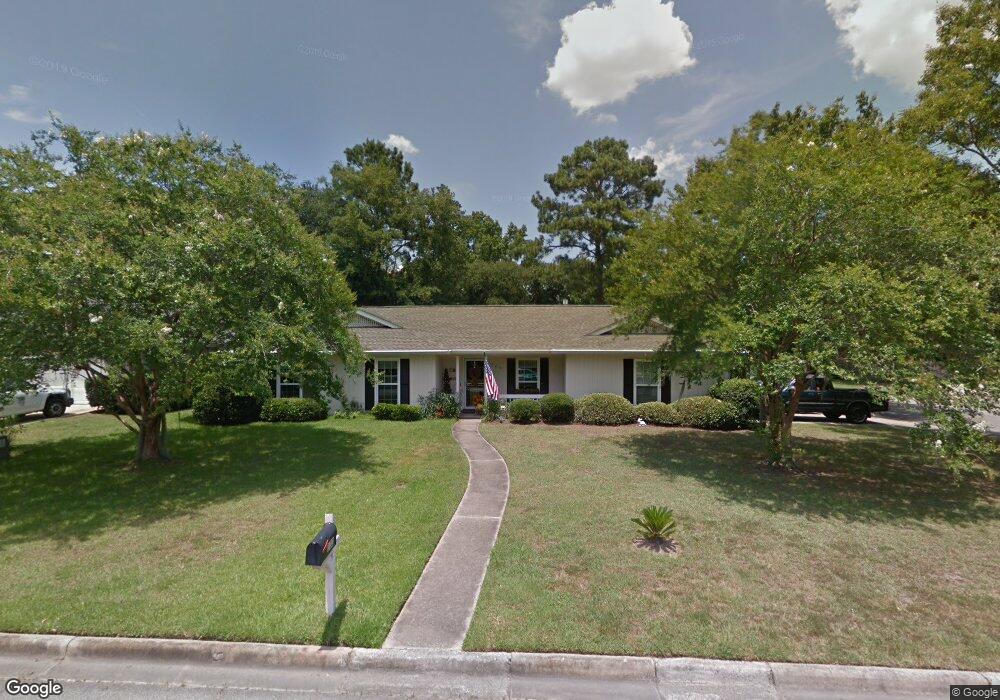
102 S Nicholson Cir Savannah, GA 31419
Windsor Forest NeighborhoodEstimated Value: $276,000 - $307,000
3
Beds
2
Baths
1,367
Sq Ft
$210/Sq Ft
Est. Value
About This Home
This home is located at 102 S Nicholson Cir, Savannah, GA 31419 and is currently estimated at $287,295, approximately $210 per square foot. 102 S Nicholson Cir is a home located in Chatham County with nearby schools including Windsor Forest High School, Windsor Forest Elementary School, and Southwest Middle School.
Ownership History
Date
Name
Owned For
Owner Type
Purchase Details
Closed on
Sep 15, 2022
Sold by
Hutteman Ronald L
Bought by
Hutteman Ronald L and Hutteman Carol J
Current Estimated Value
Purchase Details
Closed on
Jul 23, 2015
Sold by
Skylar Properties Llc
Bought by
Hutteman Ronald L
Home Financials for this Owner
Home Financials are based on the most recent Mortgage that was taken out on this home.
Original Mortgage
$168,850
Interest Rate
4.08%
Purchase Details
Closed on
Jan 7, 2015
Sold by
Federal Home Loan Mortgage Corporation
Bought by
Skylar Properties Llc
Purchase Details
Closed on
Mar 4, 2014
Sold by
Santander Bank Na
Bought by
Federal Home Loan Mortgage Corporation
Create a Home Valuation Report for This Property
The Home Valuation Report is an in-depth analysis detailing your home's value as well as a comparison with similar homes in the area
Home Values in the Area
Average Home Value in this Area
Purchase History
| Date | Buyer | Sale Price | Title Company |
|---|---|---|---|
| Hutteman Ronald L | -- | -- | |
| Skylar Properties Llc | $85,000 | -- | |
| Federal Home Loan Mortgage Corporation | $92,499 | -- | |
| Santander Bank | $92,499 | -- | |
| Hutteman Ronald L | $164,900 | -- |
Source: Public Records
Mortgage History
| Date | Status | Borrower | Loan Amount |
|---|---|---|---|
| Previous Owner | Hutteman Ronald L | $168,850 |
Source: Public Records
Tax History
| Year | Tax Paid | Tax Assessment Tax Assessment Total Assessment is a certain percentage of the fair market value that is determined by local assessors to be the total taxable value of land and additions on the property. | Land | Improvement |
|---|---|---|---|---|
| 2025 | $578 | $85,720 | $20,000 | $65,720 |
| 2024 | $2 | $87,200 | $20,000 | $67,200 |
| 2023 | $234 | $78,280 | $20,000 | $58,280 |
| 2022 | $431 | $66,880 | $12,000 | $54,880 |
| 2021 | $631 | $59,040 | $12,000 | $47,040 |
| 2020 | $412 | $58,840 | $12,000 | $46,840 |
| 2019 | $867 | $52,600 | $12,000 | $40,600 |
| 2018 | $1,734 | $51,920 | $12,000 | $39,920 |
| 2017 | $1,556 | $53,080 | $12,000 | $41,080 |
| 2016 | $1,028 | $53,320 | $12,000 | $41,320 |
| 2015 | $1,732 | $41,520 | $5,600 | $35,920 |
Source: Public Records
Map
Nearby Homes
- 138 Bordeaux Ln
- 124 Bordeaux Ln
- 602 Plantation Dr
- 108 Greenbriar Dr
- 412 Arlington Rd
- 66 Brown Pelican Dr
- 96 Brown Pelican Dr
- 12825 Stillwood Dr
- 12823 Stillwood Dr
- 138 Brown Pelican Dr
- 13008 Largo Dr
- 13210 Largo Dr
- 407 Willow Rd
- 12517 Golf Club Dr
- 198 Coffee Pointe Dr
- 324 Tanglewood Rd
- 143 Arusha Ave
- 21 Willow Rd
- 23 Canterbury Cir
- 10 Arabica Ln
- 102 S Nicholson Cir
- 102 S Nicholson Cir Unit 64
- 104 S Nicholson Cir
- 104 S Nicholson Cir
- S S Nicholson Cir Unit 64
- S S Nicholson Cir
- 101 S Nicholson Cir
- 42 S Nicholson Cir
- 106 S Nicholson Cir
- 106 S Nicholson Cir
- 101 N Nicholson Cir
- 103 N Nicholson Cir
- 103 S Nicholson Cir
- 103 S Nicholson Cir
- 43 S Nicholson Cir
- 40 S Nicholson Cir
- 105 S Nicholson Cir
- 105 N Nicholson Cir
- 108 S Nicholson Cir
- 108 S Nicholson Cir
Your Personal Tour Guide
Ask me questions while you tour the home.