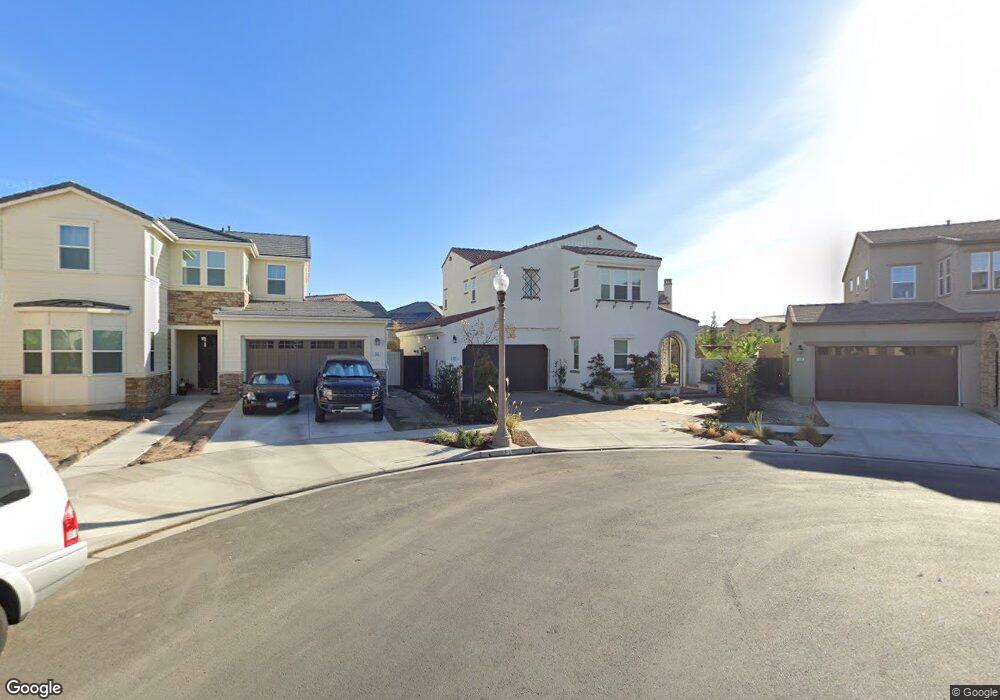
102 Straw Irvine, CA 92618
Great Park NeighborhoodEstimated Value: $2,488,772 - $2,635,000
4
Beds
4
Baths
2,615
Sq Ft
$980/Sq Ft
Est. Value
About This Home
This home is located at 102 Straw, Irvine, CA 92618 and is currently estimated at $2,561,693, approximately $979 per square foot. 102 Straw is a home with nearby schools including Beacon Park, Portola High School, and Woodbury Elementary School.
Ownership History
Date
Name
Owned For
Owner Type
Purchase Details
Closed on
Oct 20, 2016
Sold by
K Hovnanian At Beacon Park Area 129 Llc
Bought by
Liu Jialing and Chen Xi
Current Estimated Value
Purchase Details
Closed on
Mar 21, 2016
Sold by
Cdcg 3 Hov Lp
Bought by
K Hovnanian At Beacon Park Area 129 Llc
Create a Home Valuation Report for This Property
The Home Valuation Report is an in-depth analysis detailing your home's value as well as a comparison with similar homes in the area
Home Values in the Area
Average Home Value in this Area
Purchase History
| Date | Buyer | Sale Price | Title Company |
|---|---|---|---|
| Liu Jialing | $1,309,500 | Orange Coast Title Company | |
| K Hovnanian At Beacon Park Area 129 Llc | $2,687,000 | First American Title Company |
Source: Public Records
Mortgage History
| Date | Status | Borrower | Loan Amount |
|---|---|---|---|
| Closed | K Hovnanian At Beacon Park Area 129 Llc | $0 |
Source: Public Records
Tax History
| Year | Tax Paid | Tax Assessment Tax Assessment Total Assessment is a certain percentage of the fair market value that is determined by local assessors to be the total taxable value of land and additions on the property. | Land | Improvement |
|---|---|---|---|---|
| 2025 | $24,851 | $1,551,067 | $939,331 | $611,736 |
| 2024 | $24,851 | $1,520,654 | $920,912 | $599,742 |
| 2023 | $24,311 | $1,490,838 | $902,855 | $587,983 |
| 2022 | $23,835 | $1,461,606 | $885,152 | $576,454 |
| 2021 | $23,367 | $1,432,948 | $867,797 | $565,151 |
| 2020 | $23,191 | $1,418,255 | $858,898 | $559,357 |
| 2019 | $22,828 | $1,390,447 | $842,057 | $548,390 |
| 2018 | $22,423 | $1,363,184 | $825,546 | $537,638 |
| 2017 | $20,416 | $1,189,621 | $685,119 | $504,502 |
| 2016 | $15,465 | $632,862 | $632,862 | $0 |
| 2015 | $8,298 | $623,356 | $623,356 | $0 |
Source: Public Records
Map
Nearby Homes
Your Personal Tour Guide
Ask me questions while you tour the home.