102 Strong St Easthampton, MA 01027
Estimated Value: $568,000 - $682,000
3
Beds
3
Baths
2,226
Sq Ft
$287/Sq Ft
Est. Value
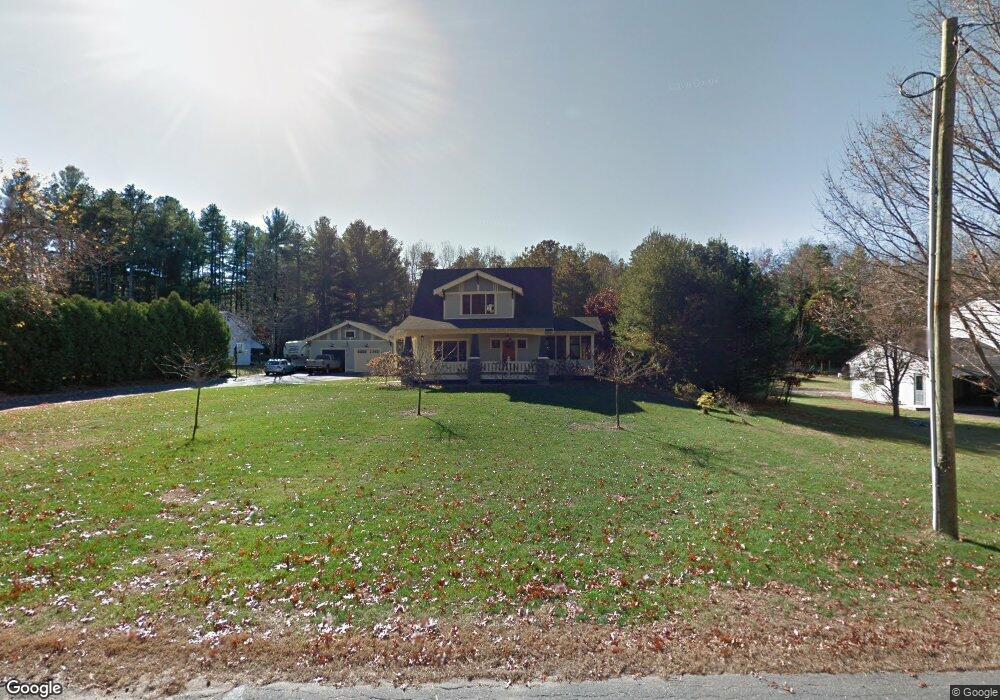
About This Home
This home is located at 102 Strong St, Easthampton, MA 01027 and is currently estimated at $638,333, approximately $286 per square foot. 102 Strong St is a home located in Hampshire County with nearby schools including Easthampton High School, Hilltown Cooperative Charter Public School, and Calvary Baptist Christian School.
Ownership History
Date
Name
Owned For
Owner Type
Purchase Details
Closed on
Nov 21, 2017
Sold by
Picard Richard T and Picard Joann B
Bought by
Evans Leah and Picard Wade
Current Estimated Value
Purchase Details
Closed on
Sep 3, 2010
Sold by
Dicey Joseph
Bought by
Picard Richard T and Picard Joann B
Purchase Details
Closed on
Apr 16, 2003
Sold by
Dicey Curtis
Bought by
Dicey Joseph
Create a Home Valuation Report for This Property
The Home Valuation Report is an in-depth analysis detailing your home's value as well as a comparison with similar homes in the area
Home Values in the Area
Average Home Value in this Area
Purchase History
| Date | Buyer | Sale Price | Title Company |
|---|---|---|---|
| Evans Leah | -- | -- | |
| Picard Richard T | $120,000 | -- | |
| Dicey Joseph | -- | -- |
Source: Public Records
Mortgage History
| Date | Status | Borrower | Loan Amount |
|---|---|---|---|
| Previous Owner | Dicey Joseph | $270,000 | |
| Previous Owner | Dicey Joseph | $229,500 |
Source: Public Records
Tax History
| Year | Tax Paid | Tax Assessment Tax Assessment Total Assessment is a certain percentage of the fair market value that is determined by local assessors to be the total taxable value of land and additions on the property. | Land | Improvement |
|---|---|---|---|---|
| 2025 | $7,334 | $536,500 | $123,100 | $413,400 |
| 2024 | $7,080 | $522,100 | $119,500 | $402,600 |
| 2023 | $5,384 | $367,500 | $94,800 | $272,700 |
| 2022 | $6,075 | $367,500 | $94,800 | $272,700 |
| 2021 | $6,683 | $381,000 | $94,800 | $286,200 |
| 2020 | $6,527 | $367,500 | $94,800 | $272,700 |
| 2019 | $5,598 | $362,100 | $94,800 | $267,300 |
| 2018 | $5,405 | $337,800 | $89,500 | $248,300 |
| 2017 | $5,096 | $314,400 | $85,900 | $228,500 |
| 2016 | $5,006 | $321,100 | $85,900 | $235,200 |
| 2015 | $4,865 | $321,100 | $85,900 | $235,200 |
Source: Public Records
Map
Nearby Homes
- 4 Laurel Dr
- 36 Line St
- 1 Plain St
- 95 Gunn Rd
- 36 & 36R Holly Cir
- 245 Park St
- 7 Western View Rd
- 2 W Park Dr
- 6 S St & Abutting Lots
- 48 Gunn Rd
- 41 South St Unit 11
- 50 Lot 3 Mountain Rd
- 36 County Rd
- 38 College Hwy
- 385 Main St
- 19 Mount Tom Ave Unit 19
- M143 &152 Glendale St
- 19 Nicols Way Unit 19
- 37 Laura Ln
- 12 Golden Cir