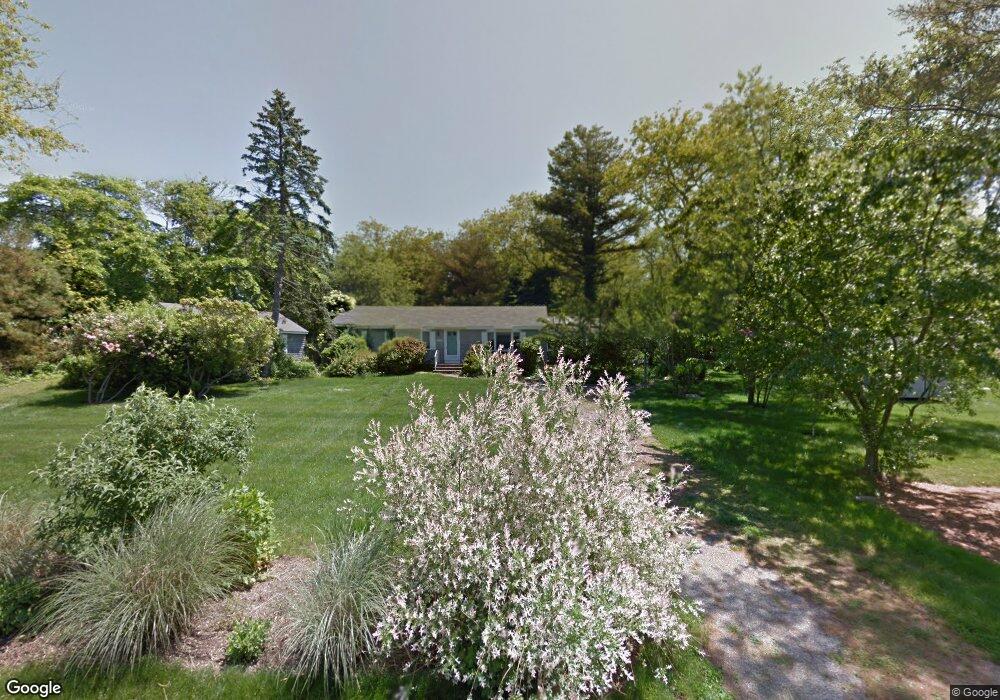
102 Sunset Dr Charlestown, RI 02813
Estimated Value: $1,171,678 - $1,637,000
2
Beds
1
Bath
1,128
Sq Ft
$1,244/Sq Ft
Est. Value
About This Home
This home is located at 102 Sunset Dr, Charlestown, RI 02813 and is currently estimated at $1,402,670, approximately $1,243 per square foot. 102 Sunset Dr is a home located in Washington County with nearby schools including Chariho Regional Middle School and Chariho High School.
Ownership History
Date
Name
Owned For
Owner Type
Purchase Details
Closed on
Apr 20, 2015
Sold by
Casey Lisa C
Bought by
Lisa C Casey Ret
Current Estimated Value
Purchase Details
Closed on
Jun 22, 2007
Sold by
Fitzpatrick Alice K
Bought by
Casey Michael E and Casey Lisa C
Home Financials for this Owner
Home Financials are based on the most recent Mortgage that was taken out on this home.
Original Mortgage
$640,000
Interest Rate
6.14%
Create a Home Valuation Report for This Property
The Home Valuation Report is an in-depth analysis detailing your home's value as well as a comparison with similar homes in the area
Home Values in the Area
Average Home Value in this Area
Purchase History
| Date | Buyer | Sale Price | Title Company |
|---|---|---|---|
| Lisa C Casey Ret | -- | -- | |
| Casey Lisa C | -- | -- | |
| Casey Michael E | $400,000 | -- | |
| Casey Michael E | $400,000 | -- |
Source: Public Records
Mortgage History
| Date | Status | Borrower | Loan Amount |
|---|---|---|---|
| Previous Owner | Casey Michael E | $640,000 |
Source: Public Records
Tax History
| Year | Tax Paid | Tax Assessment Tax Assessment Total Assessment is a certain percentage of the fair market value that is determined by local assessors to be the total taxable value of land and additions on the property. | Land | Improvement |
|---|---|---|---|---|
| 2025 | $6,728 | $1,134,500 | $951,200 | $183,300 |
| 2024 | $6,557 | $1,134,500 | $951,200 | $183,300 |
| 2023 | $6,512 | $1,134,500 | $951,200 | $183,300 |
| 2022 | $5,696 | $697,200 | $550,200 | $147,000 |
| 2021 | $5,703 | $697,200 | $550,200 | $147,000 |
| 2020 | $5,738 | $697,200 | $550,200 | $147,000 |
| 2019 | $6,040 | $654,400 | $550,200 | $104,200 |
| 2018 | $6,308 | $654,400 | $550,200 | $104,200 |
| 2017 | $6,276 | $654,400 | $550,200 | $104,200 |
| 2016 | $6,511 | $637,700 | $522,000 | $115,700 |
| 2015 | $6,447 | $637,700 | $522,000 | $115,700 |
| 2014 | $6,313 | $637,700 | $522,000 | $115,700 |
Source: Public Records
Map
Nearby Homes
- 34 Buddington Rd
- 853 W Beach Rd
- 137 Cove Point Rd E
- 5717 Post Rd
- 14 Evergreen Ln
- 135 Ross Hill Rd
- 143 Ross Hill Rd
- 342 Post Rd
- 27 W Willow Ln
- 5 Robin Hollow Ln
- 112 Noyes Neck Rd
- 7 Fenway Rd
- 11 Bucks Trail
- 15 Breach Dr
- 22 Breach Dr
- 30 Clifford Dr
- 20 Snowberry Ln
- 597 Atlantic Ave
- 46 Salt Pond Way
- 0 Post Rd Unit 1398131
Your Personal Tour Guide
Ask me questions while you tour the home.