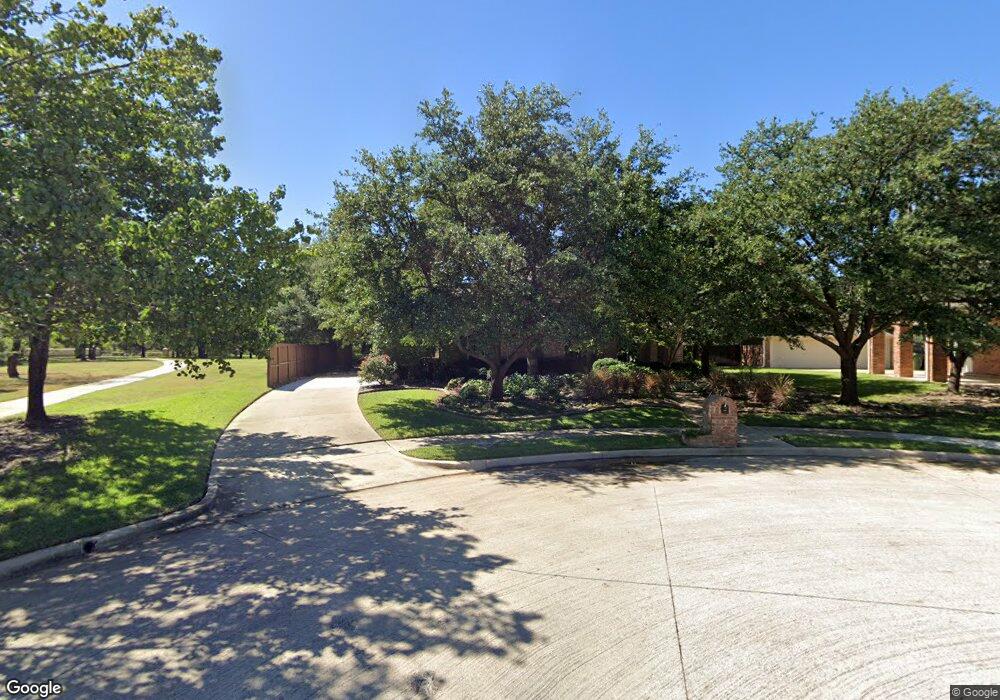
102 Swallow Ct Southlake, TX 76092
Estimated Value: $844,000 - $905,000
4
Beds
3
Baths
2,873
Sq Ft
$306/Sq Ft
Est. Value
About This Home
This home is located at 102 Swallow Ct, Southlake, TX 76092 and is currently estimated at $880,454, approximately $306 per square foot. 102 Swallow Ct is a home located in Tarrant County with nearby schools including Carroll Elementary School, Don T. Durham Intermediate School, and Carroll Middle School.
Ownership History
Date
Name
Owned For
Owner Type
Purchase Details
Closed on
May 30, 2019
Sold by
Premock Mark and Graber Julie D
Bought by
Story Shelley
Current Estimated Value
Purchase Details
Closed on
Apr 8, 1999
Sold by
Munday Daniel R and Munday Patrice A
Bought by
Premock Mark and Graber Julie D
Home Financials for this Owner
Home Financials are based on the most recent Mortgage that was taken out on this home.
Original Mortgage
$207,900
Interest Rate
7.06%
Purchase Details
Closed on
Dec 28, 1995
Sold by
Centennial Homes Inc
Bought by
Munday Daniel R and Munday Patrice A
Home Financials for this Owner
Home Financials are based on the most recent Mortgage that was taken out on this home.
Original Mortgage
$189,400
Interest Rate
7.34%
Mortgage Type
Balloon
Purchase Details
Closed on
Jul 15, 1994
Sold by
Fred Joyce Mary Myers Enterprises Inc
Bought by
Centennial Homes Inc
Create a Home Valuation Report for This Property
The Home Valuation Report is an in-depth analysis detailing your home's value as well as a comparison with similar homes in the area
Home Values in the Area
Average Home Value in this Area
Purchase History
| Date | Buyer | Sale Price | Title Company |
|---|---|---|---|
| Story Shelley | -- | Independence Title Co | |
| Premock Mark | -- | First American Title Co | |
| Munday Daniel R | -- | Stewart Title | |
| Centennial Homes Inc | -- | -- |
Source: Public Records
Mortgage History
| Date | Status | Borrower | Loan Amount |
|---|---|---|---|
| Previous Owner | Premock Mark | $207,900 | |
| Previous Owner | Munday Daniel R | $189,400 |
Source: Public Records
Tax History Compared to Growth
Tax History
| Year | Tax Paid | Tax Assessment Tax Assessment Total Assessment is a certain percentage of the fair market value that is determined by local assessors to be the total taxable value of land and additions on the property. | Land | Improvement |
|---|---|---|---|---|
| 2025 | $9,803 | $608,000 | $242,250 | $365,750 |
| 2024 | $9,803 | $635,775 | $242,250 | $393,525 |
| 2023 | $11,458 | $676,130 | $242,250 | $433,880 |
| 2022 | $12,329 | $571,490 | $161,500 | $409,990 |
| 2021 | $11,896 | $521,750 | $161,500 | $360,250 |
| 2020 | $11,116 | $483,613 | $145,350 | $338,263 |
| 2019 | $11,274 | $470,029 | $120,000 | $350,029 |
| 2018 | $9,526 | $423,258 | $120,000 | $303,258 |
| 2017 | $9,537 | $450,798 | $100,000 | $350,798 |
| 2016 | $8,670 | $405,719 | $100,000 | $305,719 |
| 2015 | $7,604 | $318,000 | $55,000 | $263,000 |
| 2014 | $7,604 | $318,000 | $55,000 | $263,000 |
Source: Public Records
Map
Nearby Homes
- 205 Lovegrass Ln
- 1712 Wild Rose Way
- 2530 & 2580 W Southlake Blvd
- 1807 Mesquite Ct
- 207 Killdeer Trail
- 2116 Camden Cir
- 503 Indian Paintbrush Way
- 2304 Top Rail Ln
- 203 Donley Ct
- 1811 Redwing Ct
- 275 Timberline Ln
- 204 Southridge Lakes Pkwy
- 1340 Meadow Glen
- 404 Branding Iron Ct
- 550 N Peytonville Ave
- 904 Palos Verdes Trail
- 690 S Peytonville Ave
- 2655 Johnson Rd
- 710 Deer Hollow Blvd
- 203 Manor Place
- 104 Swallow Ct
- 103 Meadowlark Ln
- 101 Meadowlark Ln
- 106 Swallow Ct
- 105 Meadowlark Ln
- 103 Swallow Ct
- 107 Meadowlark Ln
- 108 Swallow Ct
- 105 Swallow Ct
- 109 Meadowlark Ln
- 110 Swallow Ct
- 107 Swallow Ct
- 1901 W Southlake Blvd
- 109 Swallow Ct
- 201 Meadowlark Ln
- 200 Swallow Dr
- 104 Starling Ct
- 203 Meadowlark Ln
- 202 Swallow Dr
- 1714 Wild Rose Way