Estimated Value: $528,000 - $564,000
3
Beds
3
Baths
1,800
Sq Ft
$299/Sq Ft
Est. Value
About This Home
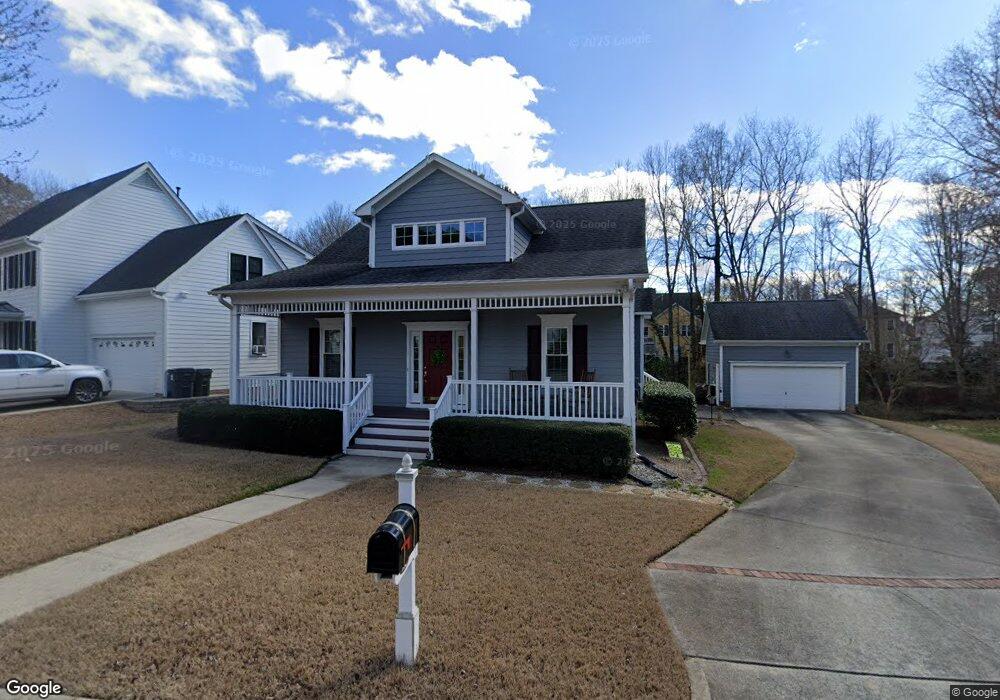
This home is located at 102 Talisker Ct, Apex, NC 27502 and is currently estimated at $538,427, approximately $299 per square foot. 102 Talisker Ct is a home located in Wake County with nearby schools including Scotts Ridge Elementary School, Apex Middle, and Apex High School.
Ownership History
Date
Name
Owned For
Owner Type
Purchase Details
Closed on
Jul 23, 2012
Sold by
Semchenko Edgar A and Semchenko Barbara T
Bought by
Stark Kenneth W and Stark Lynn I
Current Estimated Value
Home Financials for this Owner
Home Financials are based on the most recent Mortgage that was taken out on this home.
Original Mortgage
$125,000
Outstanding Balance
$18,445
Interest Rate
2.99%
Mortgage Type
New Conventional
Estimated Equity
$519,982
Purchase Details
Closed on
Jan 25, 2002
Sold by
Scott Richard C
Bought by
Semchenko Edgar A and Semchenko Barbara T
Purchase Details
Closed on
Jun 12, 1998
Sold by
Bond Building Ltd
Bought by
Scott Richard C
Home Financials for this Owner
Home Financials are based on the most recent Mortgage that was taken out on this home.
Original Mortgage
$116,400
Interest Rate
7.23%
Create a Home Valuation Report for This Property
The Home Valuation Report is an in-depth analysis detailing your home's value as well as a comparison with similar homes in the area
Home Values in the Area
Average Home Value in this Area
Purchase History
| Date | Buyer | Sale Price | Title Company |
|---|---|---|---|
| Stark Kenneth W | $220,000 | None Available | |
| Semchenko Edgar A | $181,000 | -- | |
| Scott Richard C | $166,500 | -- |
Source: Public Records
Mortgage History
| Date | Status | Borrower | Loan Amount |
|---|---|---|---|
| Open | Stark Kenneth W | $125,000 | |
| Previous Owner | Scott Richard C | $116,400 |
Source: Public Records
Tax History Compared to Growth
Tax History
| Year | Tax Paid | Tax Assessment Tax Assessment Total Assessment is a certain percentage of the fair market value that is determined by local assessors to be the total taxable value of land and additions on the property. | Land | Improvement |
|---|---|---|---|---|
| 2025 | $4,477 | $510,502 | $180,000 | $330,502 |
| 2024 | $4,377 | $510,502 | $180,000 | $330,502 |
| 2023 | $3,644 | $330,319 | $73,000 | $257,319 |
| 2022 | $3,421 | $330,319 | $73,000 | $257,319 |
| 2021 | $3,290 | $330,319 | $73,000 | $257,319 |
| 2020 | $3,257 | $330,319 | $73,000 | $257,319 |
| 2019 | $3,143 | $274,981 | $73,000 | $201,981 |
| 2018 | $2,961 | $274,981 | $73,000 | $201,981 |
| 2017 | $2,756 | $274,981 | $73,000 | $201,981 |
| 2016 | $2,716 | $274,981 | $73,000 | $201,981 |
| 2015 | $2,684 | $265,214 | $68,000 | $197,214 |
| 2014 | -- | $265,214 | $68,000 | $197,214 |
Source: Public Records
Map
Nearby Homes
- 1800 Pierre Place
- 1105 Capitata Crossing
- 1208 Tartarian Trail
- 1116 Silky Dogwood Trail
- 2008 Silky Dogwood Trail
- 1209 Haywards Heath Ln
- 105 Troyer Place
- 3014 Silky Dogwood Trail
- 102 Darley Dale Loop
- 235 Eyam Hall Ln
- 232 Eyam Hall Ln
- 0 Jb Morgan Rd Unit 10051948
- 427 Eyam Hall Ln
- 209 Homegate Cir
- 541 Village Loop Dr
- 402 Village Loop Dr
- 907 Haddon Hall Dr
- 303 Knightsborough Way
- 103 Garden Side Way
- 1004 Wild Sonnet Ct
- 100 Talisker Ct
- 103 Talisker Ct
- 106 Talisker Ct
- 103 Dunvegan Ct
- 105 Dunvegan Ct
- 101 Dunvegan Ct
- 101 Talisker Ct
- 107 Talisker Ct
- 201 Cameron Glen Dr
- 107 Dunvegan Ct
- 103 Cameron Glen Dr
- 203 Cameron Glen Dr
- 101 Cameron Glen Dr
- 205 Cameron Glen Dr
- 102 Dunvegan Ct
- 100 Dunvegan Ct
- 106 Dunvegan Ct
- 207 Cameron Glen Dr
- 104 Dunvegan Ct
- 1199 Alsace Dr