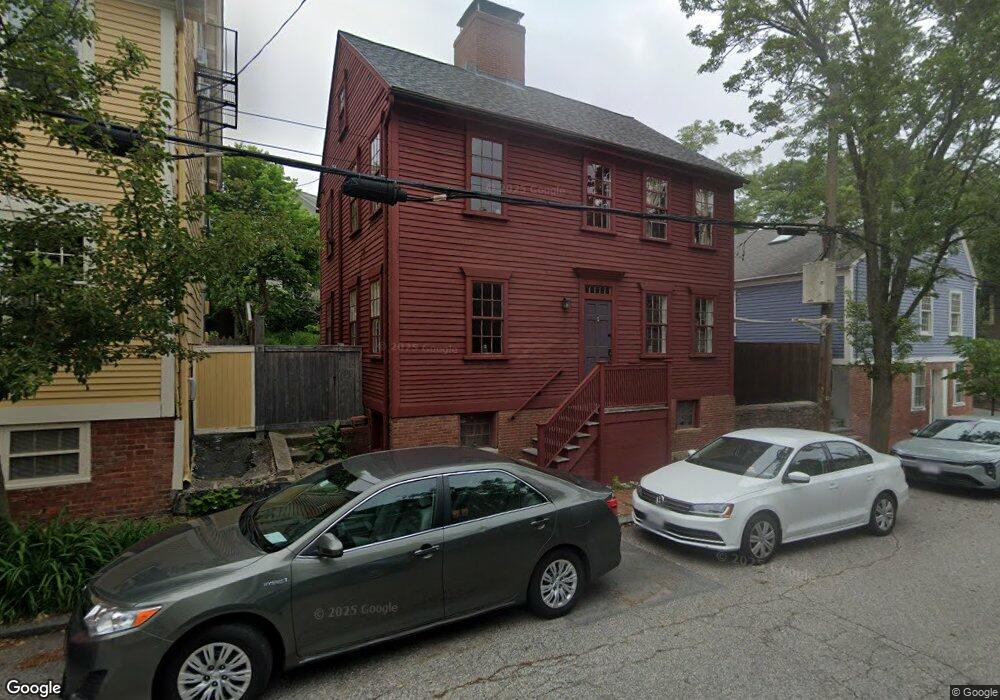
102 Transit St Providence, RI 02906
Fox Point NeighborhoodEstimated Value: $720,000 - $932,000
3
Beds
2
Baths
1,642
Sq Ft
$508/Sq Ft
Est. Value
About This Home
This home is located at 102 Transit St, Providence, RI 02906 and is currently estimated at $834,153, approximately $508 per square foot. 102 Transit St is a home located in Providence County with nearby schools including French-American School of Rhode Island, Wheeler School, and Moses Brown School.
Ownership History
Date
Name
Owned For
Owner Type
Purchase Details
Closed on
Dec 28, 2010
Sold by
Foley Stephen Merriam and Risher-Foley Mary Jo
Bought by
Butler Margaret N
Current Estimated Value
Home Financials for this Owner
Home Financials are based on the most recent Mortgage that was taken out on this home.
Original Mortgage
$250,000
Outstanding Balance
$164,749
Interest Rate
4.17%
Estimated Equity
$669,404
Create a Home Valuation Report for This Property
The Home Valuation Report is an in-depth analysis detailing your home's value as well as a comparison with similar homes in the area
Home Values in the Area
Average Home Value in this Area
Purchase History
| Date | Buyer | Sale Price | Title Company |
|---|---|---|---|
| Butler Margaret N | $350,000 | -- |
Source: Public Records
Mortgage History
| Date | Status | Borrower | Loan Amount |
|---|---|---|---|
| Open | Butler Margaret N | $250,000 |
Source: Public Records
Tax History
| Year | Tax Paid | Tax Assessment Tax Assessment Total Assessment is a certain percentage of the fair market value that is determined by local assessors to be the total taxable value of land and additions on the property. | Land | Improvement |
|---|---|---|---|---|
| 2025 | $6,639 | $790,300 | $533,300 | $257,000 |
| 2024 | $11,483 | $625,800 | $375,300 | $250,500 |
| 2023 | $11,483 | $625,800 | $375,300 | $250,500 |
| 2022 | $11,139 | $625,800 | $375,300 | $250,500 |
| 2021 | $10,573 | $430,500 | $264,700 | $165,800 |
| 2020 | $10,573 | $430,500 | $264,700 | $165,800 |
| 2019 | $10,573 | $430,500 | $264,700 | $165,800 |
| 2018 | $13,027 | $407,600 | $251,600 | $156,000 |
| 2017 | $13,027 | $407,600 | $251,600 | $156,000 |
| 2016 | $13,027 | $407,600 | $251,600 | $156,000 |
| 2015 | $13,892 | $419,700 | $262,600 | $157,100 |
| 2014 | $14,165 | $419,700 | $262,600 | $157,100 |
| 2013 | $14,165 | $419,700 | $262,600 | $157,100 |
Source: Public Records
Map
Nearby Homes
- 84 Transit St
- 38 Transit St Unit 3
- 388 S Main St Unit 66
- 323 Wickenden St
- 555 S Main St Unit 321
- 555 S Water St Unit 212
- 374 Wickenden St
- 427 Wickenden St
- 16 Governor St
- 20 Governor St
- 42 E Transit St
- 42 Fremont St
- 32 Custom House St Unit 201
- 670 Wickenden St
- 14 Amy St
- 18 Amy St
- 45 E George St
- 6 Olive St
- 65 Weybosset St Unit 314
- 225 Weybosset St Unit 2
Your Personal Tour Guide
Ask me questions while you tour the home.