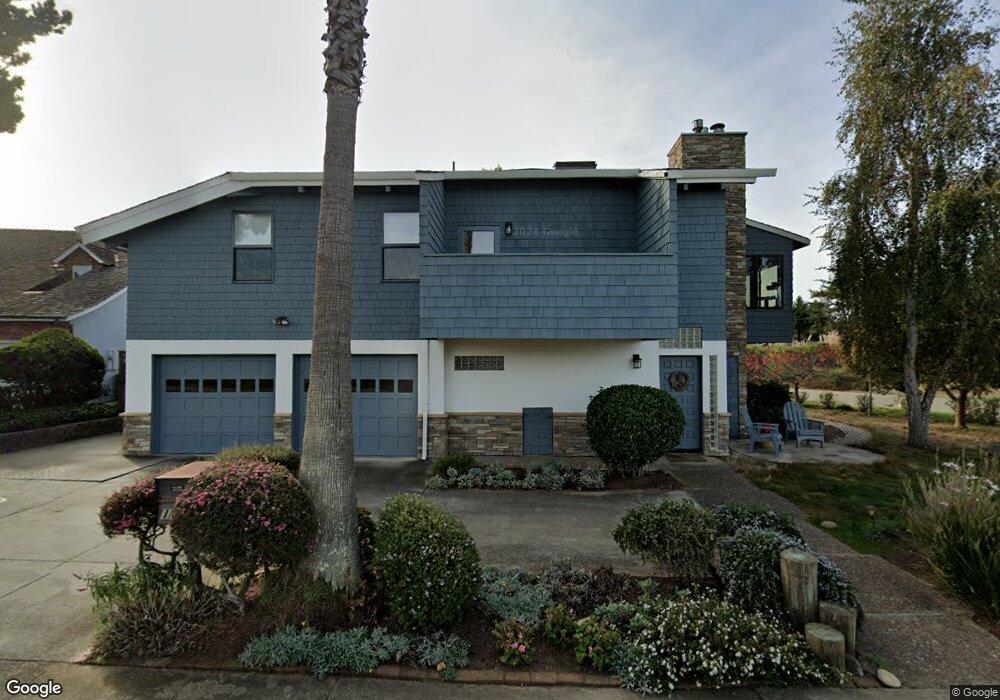
102 Via Trinita Aptos, CA 95003
Rio del Mar NeighborhoodEstimated Value: $1,848,781 - $2,687,000
3
Beds
2
Baths
2,225
Sq Ft
$937/Sq Ft
Est. Value
About This Home
This home is located at 102 Via Trinita, Aptos, CA 95003 and is currently estimated at $2,085,695, approximately $937 per square foot. 102 Via Trinita is a home located in Santa Cruz County with nearby schools including Rio Del Mar Elementary School, Aptos Junior High School, and Aptos High School.
Ownership History
Date
Name
Owned For
Owner Type
Purchase Details
Closed on
Nov 1, 2016
Sold by
Biswell Lorraina Conover and Biswell Lorraina Conover
Bought by
Biswell Lorraina Conover and Lorraina Conover Biswell 1990
Current Estimated Value
Purchase Details
Closed on
Mar 3, 2016
Sold by
Biswell Lorraina Conover and Biswell Joint Family Trust
Bought by
Biswell Joint Family Trust and Lorraina Conover Biswell Surviving Spous
Purchase Details
Closed on
Sep 28, 2001
Sold by
Biswell Roderick and Biswell Lorraina Conover
Bought by
Biswell Roderick and Biswell Lorraina Conover
Purchase Details
Closed on
Apr 4, 1994
Sold by
Biswell Roderick
Bought by
Biswell Roderick
Create a Home Valuation Report for This Property
The Home Valuation Report is an in-depth analysis detailing your home's value as well as a comparison with similar homes in the area
Home Values in the Area
Average Home Value in this Area
Purchase History
| Date | Buyer | Sale Price | Title Company |
|---|---|---|---|
| Biswell Lorraina Conover | -- | None Available | |
| Biswell Joint Family Trust | -- | None Available | |
| Biswell Roderick | -- | -- | |
| Biswell Roderick | -- | -- | |
| Biswell Roderick | -- | -- |
Source: Public Records
Tax History Compared to Growth
Tax History
| Year | Tax Paid | Tax Assessment Tax Assessment Total Assessment is a certain percentage of the fair market value that is determined by local assessors to be the total taxable value of land and additions on the property. | Land | Improvement |
|---|---|---|---|---|
| 2025 | $5,277 | $366,849 | $65,983 | $300,866 |
| 2023 | $5,129 | $352,604 | $63,421 | $289,183 |
| 2022 | $4,991 | $345,690 | $62,177 | $283,513 |
| 2021 | $4,763 | $338,912 | $60,958 | $277,954 |
| 2020 | $4,674 | $335,437 | $60,333 | $275,104 |
| 2019 | $4,588 | $328,859 | $59,150 | $269,709 |
| 2018 | $4,456 | $322,411 | $57,990 | $264,421 |
| 2017 | $4,405 | $316,090 | $56,853 | $259,237 |
| 2016 | $4,304 | $309,892 | $55,738 | $254,154 |
| 2015 | $4,228 | $305,237 | $54,901 | $250,336 |
| 2014 | $4,121 | $299,258 | $53,826 | $245,432 |
Source: Public Records
Map
Nearby Homes
- 126 Via Novella
- 522 Seascape Resort Dr
- 2146 Penasquitas Dr
- 182 Hyannis Ct
- 452 Seascape Resort Dr
- 123 Seascape Resort Dr Unit 123
- 221 Seascape Resort Dr
- 117 Seascape Resort Dr
- 312 Seascape Resort Dr
- 315 Seascape Resort Dr
- 160 Seascape Ridge Dr
- 1540 Seascape Blvd Unit 2
- 302 Seascape Resort Dr
- 420 Camino al Mar
- 138 Farallon Ct
- 60 Seascape Resort Dr
- 29 Seascape Resort Dr
- 22 Seascape Resort Dr
- 1514 Dolphin Dr
- 1325 Dolphin Dr
- 110 Via Trinita
- 118 Via Trinita
- 101 Via Trinita
- 109 Via Trinita
- 126 Via Trinita
- 117 Via Trinita
- 109 Via Novella
- 125 Via Trinita
- 134 Via Trinita
- 117 Via Novella
- 101 Via Novella
- 125 Via Novella
- 133 Via Trinita
- 142 Via Trinita
- 133 Vía Novella
- 133 Via Novella
- 102 Via Lantana
- 110 Via Lantana
- 141 Via Trinita
- 150 Via Trinita