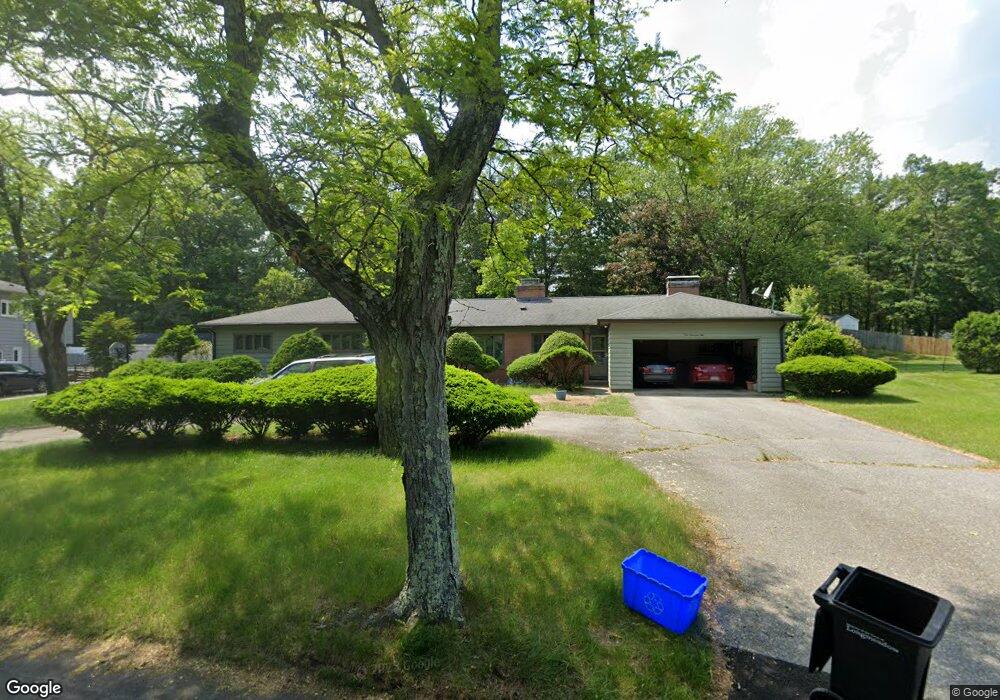
102 Wilkin Dr Longmeadow, MA 01106
Estimated Value: $538,000 - $650,000
4
Beds
3
Baths
2,560
Sq Ft
$239/Sq Ft
Est. Value
About This Home
This home is located at 102 Wilkin Dr, Longmeadow, MA 01106 and is currently estimated at $610,774, approximately $238 per square foot. 102 Wilkin Dr is a home located in Hampden County with nearby schools including Blueberry Hill, Williams Middle School, and Longmeadow High School.
Ownership History
Date
Name
Owned For
Owner Type
Purchase Details
Closed on
Jun 6, 2018
Sold by
Tully Dennis E
Bought by
Ryan Jillian and Manning Ivan
Current Estimated Value
Purchase Details
Closed on
Nov 1, 2002
Sold by
Greenberg Harriet K
Bought by
Ryan Jillian and Hamilton Erica
Home Financials for this Owner
Home Financials are based on the most recent Mortgage that was taken out on this home.
Original Mortgage
$200,000
Interest Rate
6.09%
Mortgage Type
Purchase Money Mortgage
Create a Home Valuation Report for This Property
The Home Valuation Report is an in-depth analysis detailing your home's value as well as a comparison with similar homes in the area
Home Values in the Area
Average Home Value in this Area
Purchase History
| Date | Buyer | Sale Price | Title Company |
|---|---|---|---|
| Ryan Jillian | -- | -- | |
| Tully Dennis E | -- | -- | |
| Ryan Jillian | $350,000 | -- |
Source: Public Records
Mortgage History
| Date | Status | Borrower | Loan Amount |
|---|---|---|---|
| Previous Owner | Ryan Jillian | $200,000 |
Source: Public Records
Tax History
| Year | Tax Paid | Tax Assessment Tax Assessment Total Assessment is a certain percentage of the fair market value that is determined by local assessors to be the total taxable value of land and additions on the property. | Land | Improvement |
|---|---|---|---|---|
| 2025 | $10,940 | $518,000 | $167,700 | $350,300 |
| 2024 | $10,712 | $518,000 | $167,700 | $350,300 |
| 2023 | $10,275 | $448,300 | $144,400 | $303,900 |
| 2022 | $9,794 | $397,500 | $144,400 | $253,100 |
| 2021 | $9,399 | $379,900 | $137,500 | $242,400 |
| 2020 | $9,013 | $372,300 | $129,900 | $242,400 |
| 2019 | $8,518 | $353,600 | $129,900 | $223,700 |
| 2018 | $7,928 | $325,700 | $160,400 | $165,300 |
| 2017 | $7,680 | $325,700 | $160,400 | $165,300 |
| 2016 | $7,579 | $311,500 | $153,300 | $158,200 |
| 2015 | $7,315 | $309,700 | $151,500 | $158,200 |
Source: Public Records
Map
Nearby Homes
- 112 Grassy Gutter Rd
- 59 Lawrence Dr
- 124 Tecumseh Dr
- 64 Magnolia Cir
- 642 Laurel St
- 330 Merriweather Dr
- 170 Hopkins Place
- 20 Kimberly Cir
- 53 Ashford Rd
- 111 Ashford Rd
- 0 Dennis Rd
- 83 Bliss Rd
- 441 Inverness Ln
- 70 Tennyson Dr
- 141 Longfellow Dr
- 60 Exeter Ave
- 32 Edgewood Ave
- 153 Porter Lake Dr Unit 153
- 63 Meadowlark Dr
- 53 Meadowlark Dr
Your Personal Tour Guide
Ask me questions while you tour the home.