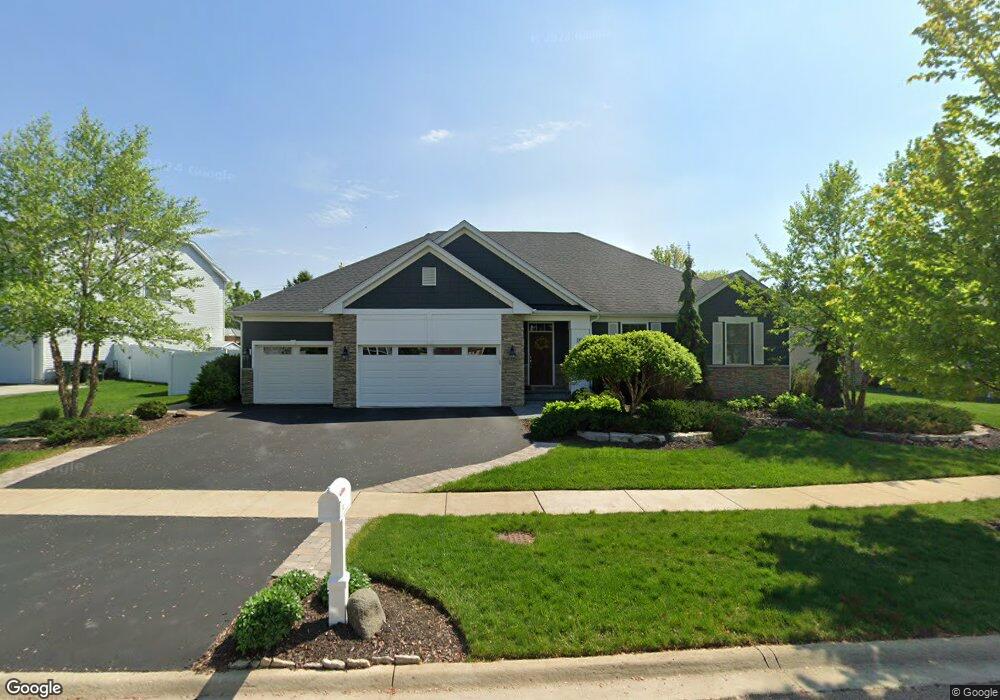
102 Willowwood Dr N Oswego, IL 60543
Northwest Oswego NeighborhoodEstimated Value: $404,000 - $449,000
2
Beds
2
Baths
1,992
Sq Ft
$217/Sq Ft
Est. Value
About This Home
This home is located at 102 Willowwood Dr N, Oswego, IL 60543 and is currently estimated at $431,739, approximately $216 per square foot. 102 Willowwood Dr N is a home located in Kendall County with nearby schools including Fox Chase Elementary School, Traughber Junior High School, and Oswego High School.
Ownership History
Date
Name
Owned For
Owner Type
Purchase Details
Closed on
Jun 27, 2023
Sold by
Knopp James C and Knopp Jill
Bought by
James C Knopp And Jill A Knopp 2023 Joint Dec and Knopp
Current Estimated Value
Purchase Details
Closed on
Aug 19, 2014
Sold by
Inishowen Llc
Bought by
Knopp James and Knopp Jill
Purchase Details
Closed on
Dec 20, 2012
Sold by
Bank Financial Fsb
Bought by
Inishowen Llc
Purchase Details
Closed on
Dec 1, 2012
Bought by
Inishowen Llc
Purchase Details
Closed on
Mar 18, 2011
Sold by
Downers Grove National Bank
Bought by
Bankfinancial Fsb
Purchase Details
Closed on
Apr 14, 2010
Sold by
Wyndham Deerpoint Homes
Bought by
Downers Grove National
Purchase Details
Closed on
Dec 30, 2008
Sold by
Wyndham Deerpoint Homes
Bought by
Efci Llc
Home Financials for this Owner
Home Financials are based on the most recent Mortgage that was taken out on this home.
Original Mortgage
$20,000
Interest Rate
5.14%
Mortgage Type
Seller Take Back
Create a Home Valuation Report for This Property
The Home Valuation Report is an in-depth analysis detailing your home's value as well as a comparison with similar homes in the area
Home Values in the Area
Average Home Value in this Area
Purchase History
| Date | Buyer | Sale Price | Title Company |
|---|---|---|---|
| James C Knopp And Jill A Knopp 2023 Joint Dec | -- | None Listed On Document | |
| Knopp James | -- | None Available | |
| Inishowen Llc | $74,250,000 | Chicago Title Insurance Co | |
| Inishowen Llc | $742,500 | -- | |
| Bankfinancial Fsb | -- | Pro Title Group Inc | |
| Downers Grove National | -- | None Available | |
| Wyndham Deerpoint Homes | -- | None Available | |
| Efci Llc | $25,000 | Chicago Title Insurance Co |
Source: Public Records
Mortgage History
| Date | Status | Borrower | Loan Amount |
|---|---|---|---|
| Previous Owner | Efci Llc | $20,000 | |
| Closed | Inishowen Llc | -- |
Source: Public Records
Tax History Compared to Growth
Tax History
| Year | Tax Paid | Tax Assessment Tax Assessment Total Assessment is a certain percentage of the fair market value that is determined by local assessors to be the total taxable value of land and additions on the property. | Land | Improvement |
|---|---|---|---|---|
| 2024 | $8,744 | $119,527 | $30,627 | $88,900 |
| 2023 | $0 | $110,673 | $28,358 | $82,315 |
| 2022 | $8,269 | $102,475 | $26,257 | $76,218 |
| 2021 | $8,111 | $97,596 | $25,007 | $72,589 |
| 2020 | $8,010 | $95,683 | $24,517 | $71,166 |
| 2019 | $8,137 | $95,683 | $24,517 | $71,166 |
| 2018 | $8,686 | $93,532 | $23,966 | $69,566 |
| 2017 | $9,229 | $89,934 | $23,044 | $66,890 |
| 2016 | $8,242 | $85,246 | $21,843 | $63,403 |
| 2015 | $877 | $99 | $99 | $0 |
| 2014 | -- | $95 | $95 | $0 |
| 2013 | -- | $96 | $96 | $0 |
Source: Public Records
Map
Nearby Homes
- 435 Fawn Dr
- 409 Fawn Dr
- 238 Willowwood Dr
- 466 Greenview Ln
- 629 Manhattan Cir
- 173 Dolores St
- 102 Mary St
- 147 Eisenhower Dr
- 505 Parkland Ct
- 403 Lake Ct
- LOT 10 SW Station Dr
- 1721 State Route 31
- 2100 Light Rd Unit 109
- 2700 Light Rd Unit 205
- 5055 U S 34
- 517 Meadowwood Ln Unit 3
- 614 Pineridge Dr N Unit 43
- 135 River Mist Dr Unit 2
- 156 River Mist Dr
- 114 Riverview Ct
- 100 Willowwood Dr N
- 104 Willowwood Dr N
- 106 Willowwood Dr N
- 39 Willowwood Dr
- 113 Willowwood Dr N
- 111 Willowwood Dr N
- 109 Willowwood Dr N
- 115 Willowwood Dr N
- 199 Willowwood Dr
- 108 Willowwood Dr N
- 190 Willowwood Dr N
- 327 Ash Grove Ln
- 189 Willowwood Dr N
- 325 Ash Grove Ln
- 602 Kiwi Ct
- 119 Willowwood Dr N
- 400 Burr Oak Dr
- 406 Fanad Ct
- 110 Willowwood Dr N
- 408 Fanad Ct