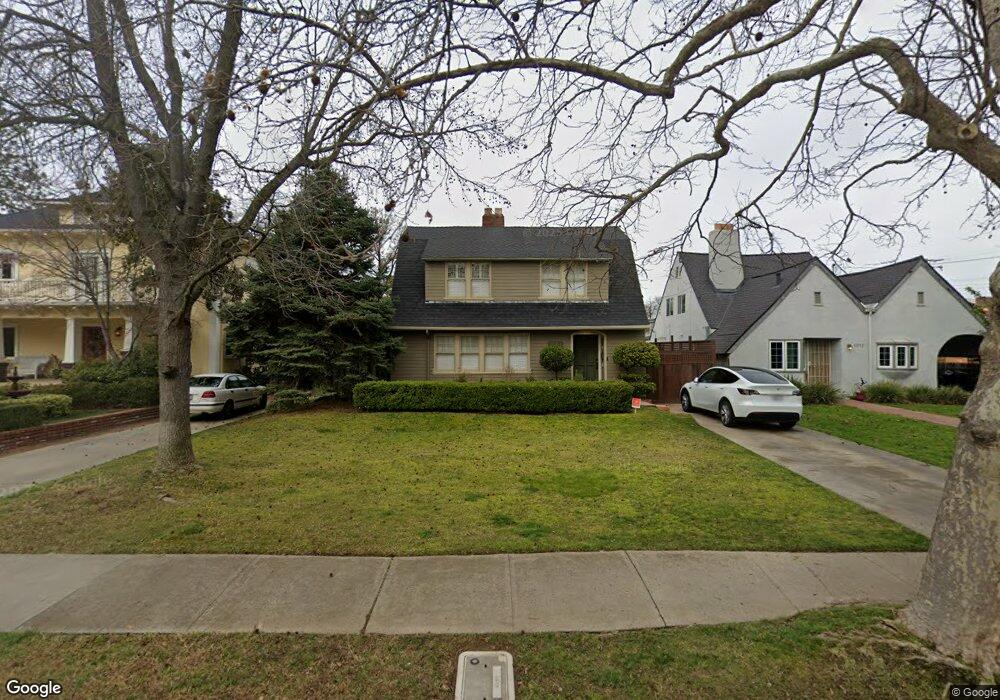
1020 38th St Sacramento, CA 95816
East Sacramento NeighborhoodEstimated Value: $846,653 - $1,061,000
4
Beds
2
Baths
1,875
Sq Ft
$495/Sq Ft
Est. Value
About This Home
This home is located at 1020 38th St, Sacramento, CA 95816 and is currently estimated at $927,413, approximately $494 per square foot. 1020 38th St is a home located in Sacramento County with nearby schools including David Lubin Elementary, Miwok Middle School, and Hiram W. Johnson High School.
Ownership History
Date
Name
Owned For
Owner Type
Purchase Details
Closed on
Oct 1, 2025
Sold by
Robertson Neil and Robertson Andrea W
Bought by
Robertson Family Trust and Robertson
Current Estimated Value
Purchase Details
Closed on
Jun 14, 2000
Sold by
Koewler Jeffrey M and Koewler Debbie D
Bought by
Robertson Neil and Robertson Andrea W
Home Financials for this Owner
Home Financials are based on the most recent Mortgage that was taken out on this home.
Original Mortgage
$252,700
Interest Rate
8.53%
Create a Home Valuation Report for This Property
The Home Valuation Report is an in-depth analysis detailing your home's value as well as a comparison with similar homes in the area
Home Values in the Area
Average Home Value in this Area
Purchase History
| Date | Buyer | Sale Price | Title Company |
|---|---|---|---|
| Robertson Family Trust | -- | None Listed On Document | |
| Robertson Neil | $320,000 | Stewart Title |
Source: Public Records
Mortgage History
| Date | Status | Borrower | Loan Amount |
|---|---|---|---|
| Previous Owner | Robertson Neil | $252,700 |
Source: Public Records
Tax History
| Year | Tax Paid | Tax Assessment Tax Assessment Total Assessment is a certain percentage of the fair market value that is determined by local assessors to be the total taxable value of land and additions on the property. | Land | Improvement |
|---|---|---|---|---|
| 2025 | $5,706 | $491,813 | $184,425 | $307,388 |
| 2024 | $5,706 | $482,170 | $180,809 | $301,361 |
| 2023 | $5,570 | $472,716 | $177,264 | $295,452 |
| 2022 | $5,474 | $463,448 | $173,789 | $289,659 |
| 2021 | $5,213 | $454,362 | $170,382 | $283,980 |
| 2020 | $5,256 | $449,704 | $168,635 | $281,069 |
| 2019 | $5,143 | $440,887 | $165,329 | $275,558 |
| 2018 | $5,008 | $432,243 | $162,088 | $270,155 |
| 2017 | $4,938 | $423,768 | $158,910 | $264,858 |
| 2016 | $4,801 | $415,460 | $155,795 | $259,665 |
| 2015 | $4,730 | $409,220 | $153,455 | $255,765 |
| 2014 | $4,599 | $401,205 | $150,450 | $250,755 |
Source: Public Records
Map
Nearby Homes
Your Personal Tour Guide
Ask me questions while you tour the home.