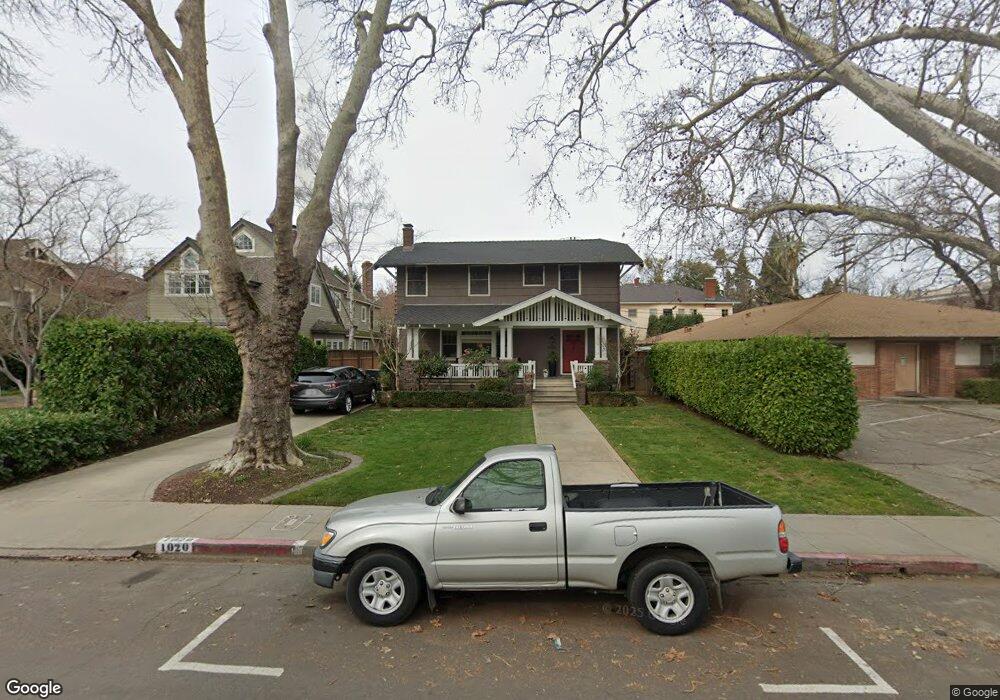
1020 40th St Sacramento, CA 95819
East Sacramento NeighborhoodEstimated Value: $867,131 - $1,146,000
3
Beds
2
Baths
1,780
Sq Ft
$560/Sq Ft
Est. Value
About This Home
This home is located at 1020 40th St, Sacramento, CA 95819 and is currently estimated at $996,283, approximately $559 per square foot. 1020 40th St is a home located in Sacramento County with nearby schools including David Lubin Elementary, Miwok Middle School, and Hiram W. Johnson High School.
Ownership History
Date
Name
Owned For
Owner Type
Purchase Details
Closed on
Mar 11, 2016
Sold by
Davis Vickie M and Davis Thomas A
Bought by
Davis Revocable Living Trust
Current Estimated Value
Purchase Details
Closed on
Oct 19, 2000
Sold by
Carter Nordlander Jeffrey Yngve and Carter Lorna
Bought by
Davis Thomas A and Davis Vickie M
Home Financials for this Owner
Home Financials are based on the most recent Mortgage that was taken out on this home.
Original Mortgage
$250,000
Outstanding Balance
$90,977
Interest Rate
7.89%
Estimated Equity
$905,306
Create a Home Valuation Report for This Property
The Home Valuation Report is an in-depth analysis detailing your home's value as well as a comparison with similar homes in the area
Home Values in the Area
Average Home Value in this Area
Purchase History
| Date | Buyer | Sale Price | Title Company |
|---|---|---|---|
| Davis Revocable Living Trust | -- | None Available | |
| Davis Thomas A | $312,500 | Stewart Title |
Source: Public Records
Mortgage History
| Date | Status | Borrower | Loan Amount |
|---|---|---|---|
| Open | Davis Thomas A | $250,000 |
Source: Public Records
Tax History
| Year | Tax Paid | Tax Assessment Tax Assessment Total Assessment is a certain percentage of the fair market value that is determined by local assessors to be the total taxable value of land and additions on the property. | Land | Improvement |
|---|---|---|---|---|
| 2025 | $5,955 | $501,175 | $110,743 | $390,432 |
| 2024 | $5,955 | $491,349 | $108,572 | $382,777 |
| 2023 | $5,815 | $481,716 | $106,444 | $375,272 |
| 2022 | $5,718 | $472,271 | $104,357 | $367,914 |
| 2021 | $5,360 | $455,011 | $102,311 | $352,700 |
| 2020 | $5,247 | $436,551 | $101,262 | $335,289 |
| 2019 | $5,070 | $422,110 | $99,277 | $322,833 |
| 2018 | $4,939 | $413,834 | $97,331 | $316,503 |
| 2017 | $4,872 | $405,721 | $95,423 | $310,298 |
| 2016 | $4,741 | $397,766 | $93,552 | $304,214 |
| 2015 | $4,672 | $391,792 | $92,147 | $299,645 |
| 2014 | $4,546 | $384,118 | $90,342 | $293,776 |
Source: Public Records
Map
Nearby Homes
Your Personal Tour Guide
Ask me questions while you tour the home.