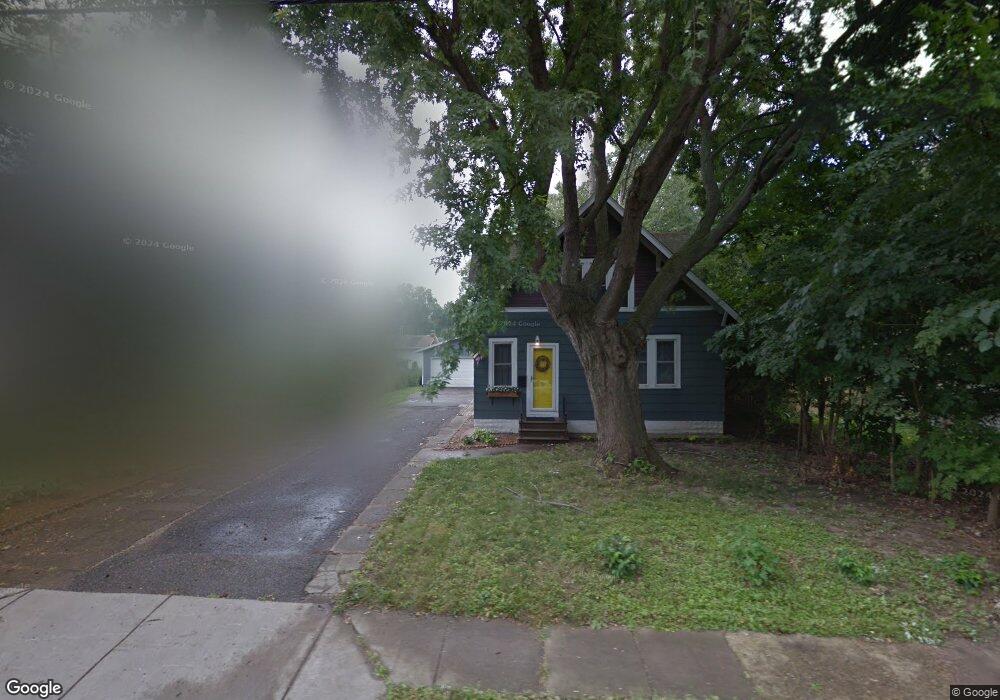
1020 43rd Ave NE Columbia Heights, MN 55421
Estimated Value: $327,024 - $363,000
4
Beds
2
Baths
1,664
Sq Ft
$209/Sq Ft
Est. Value
About This Home
This home is located at 1020 43rd Ave NE, Columbia Heights, MN 55421 and is currently estimated at $348,506, approximately $209 per square foot. 1020 43rd Ave NE is a home located in Anoka County with nearby schools including Highland Elementary School, Prodeo Academy, and Immaculate Conception Catholic School.
Ownership History
Date
Name
Owned For
Owner Type
Purchase Details
Closed on
May 12, 2017
Sold by
Baker Jeston W and Baker Renee C
Bought by
Hildebrandt Todd and Hildebrandt Adriana
Current Estimated Value
Home Financials for this Owner
Home Financials are based on the most recent Mortgage that was taken out on this home.
Original Mortgage
$226,415
Outstanding Balance
$188,498
Interest Rate
4.14%
Mortgage Type
VA
Estimated Equity
$160,008
Purchase Details
Closed on
Jun 16, 2011
Sold by
Olb Investments Llc
Bought by
Baker Jeston W
Home Financials for this Owner
Home Financials are based on the most recent Mortgage that was taken out on this home.
Original Mortgage
$128,653
Interest Rate
4.25%
Mortgage Type
FHA
Purchase Details
Closed on
May 28, 2002
Sold by
Sullivan Jacob L and Bargander Sullivan Amy
Bought by
Carchipulla Wilson B and Arenas Laura L
Purchase Details
Closed on
Jun 29, 1998
Sold by
Chester Jamie Wayne and Chester Heidi
Bought by
Sullivan Jacob L and Bargander Sullivan Amy
Create a Home Valuation Report for This Property
The Home Valuation Report is an in-depth analysis detailing your home's value as well as a comparison with similar homes in the area
Home Values in the Area
Average Home Value in this Area
Purchase History
| Date | Buyer | Sale Price | Title Company |
|---|---|---|---|
| Hildebrandt Todd | $221,651 | Custom Title Services Llc | |
| Baker Jeston W | $132,000 | -- | |
| Carchipulla Wilson B | $160,680 | -- | |
| Sullivan Jacob L | $85,500 | -- |
Source: Public Records
Mortgage History
| Date | Status | Borrower | Loan Amount |
|---|---|---|---|
| Open | Hildebrandt Todd | $226,415 | |
| Previous Owner | Baker Jeston W | $128,653 |
Source: Public Records
Tax History Compared to Growth
Tax History
| Year | Tax Paid | Tax Assessment Tax Assessment Total Assessment is a certain percentage of the fair market value that is determined by local assessors to be the total taxable value of land and additions on the property. | Land | Improvement |
|---|---|---|---|---|
| 2025 | $4,082 | $301,300 | $105,000 | $196,300 |
| 2024 | $4,082 | $295,800 | $105,000 | $190,800 |
| 2023 | $3,423 | $284,900 | $94,800 | $190,100 |
| 2022 | $3,160 | $301,900 | $94,800 | $207,100 |
| 2021 | $2,982 | $242,700 | $73,100 | $169,600 |
| 2020 | $3,066 | $217,100 | $69,100 | $148,000 |
| 2019 | $2,859 | $232,900 | $67,700 | $165,200 |
| 2018 | $2,351 | $212,400 | $0 | $0 |
| 2017 | $1,752 | $152,900 | $0 | $0 |
| 2016 | $1,725 | $127,000 | $0 | $0 |
| 2015 | $1,695 | $127,000 | $57,200 | $69,800 |
| 2014 | -- | $107,500 | $43,600 | $63,900 |
Source: Public Records
Map
Nearby Homes
- 973 43rd Ave NE
- 954 43rd Ave NE
- 1214 43rd Ave NE
- 1011 41st Ave NE Unit 208
- 999 41st Ave NE Unit 311
- 999 41st Ave NE Unit 120NE
- 1229 44th Ave NE
- 4260 Mcleod St NE
- 4348 Mcleod St NE
- 4256 Jackson St NE
- 4324 Royce St NE
- 1025 Gould Ave NE
- 3979 Reservoir Blvd
- 4146 Monroe St NE
- 4625 Taylor St NE
- 4630 Taylor St NE
- 4024 Quincy St NE
- 3942 Tyler St NE
- 4415 Madison St NE
- 3927 Reservoir Blvd
- 1026 43rd Ave NE
- 1010 43rd Ave NE
- 1032 43rd Ave NE
- 1019 43rd Ave NE
- 1021 43rd Ave NE
- 1027 43rd Ave NE
- 1006 43rd Ave NE
- 1021 42 1/2 Ave NE
- 1013 42 1/2 Ave NE
- 1011 43rd Ave NE
- 1029 42 1/2 Ave NE
- 1036 43rd Ave NE
- 1009 42 1/2 Ave NE
- 1001 1001 42 1 2 Ave NE
- 1001 1001 42 1 2-Avenue-ne
- 1001 43rd Ave NE
- 1000 43rd Ave NE
- 1000 1000 43rd-Avenue-ne
- 1009 42 1 2 Ave NE
- 1035 42 1/2 Ave NE