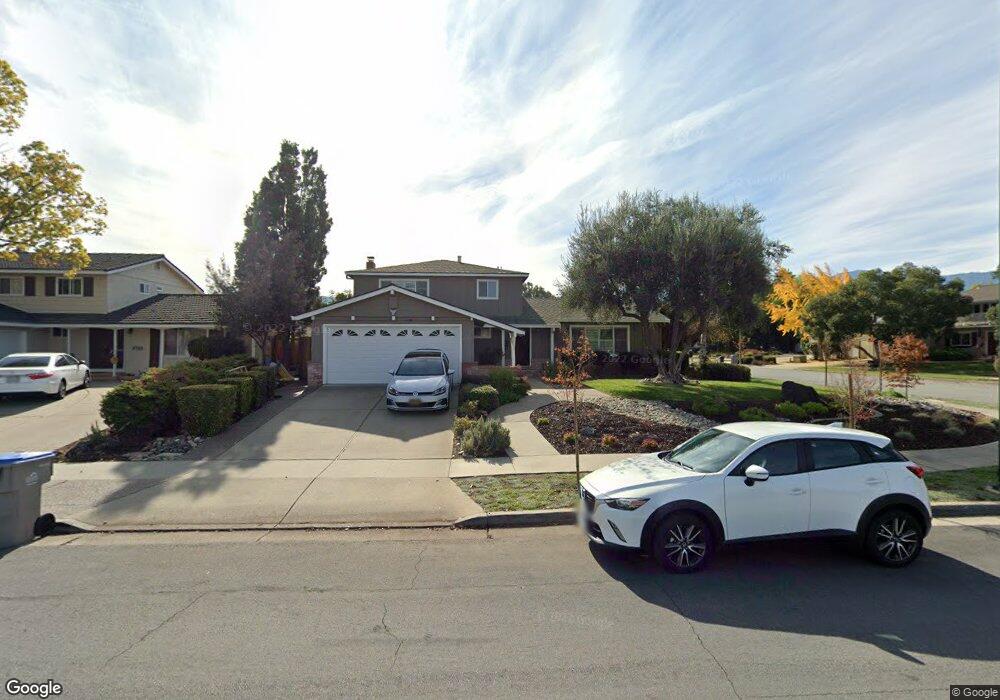
1020 Akio Way San Jose, CA 95120
Shadow Brook I NeighborhoodEstimated Value: $2,279,000 - $2,551,283
7
Beds
4
Baths
3,009
Sq Ft
$801/Sq Ft
Est. Value
About This Home
This home is located at 1020 Akio Way, San Jose, CA 95120 and is currently estimated at $2,411,071, approximately $801 per square foot. 1020 Akio Way is a home located in Santa Clara County with nearby schools including Graystone Elementary School, Bret Harte Middle School, and Leland High School.
Ownership History
Date
Name
Owned For
Owner Type
Purchase Details
Closed on
Jan 15, 2004
Sold by
Ando Wayne T and Snyder Ando Susan
Bought by
Ando Wayne T and Snyder Ando Susan
Current Estimated Value
Home Financials for this Owner
Home Financials are based on the most recent Mortgage that was taken out on this home.
Original Mortgage
$333,700
Outstanding Balance
$155,625
Interest Rate
5.86%
Mortgage Type
New Conventional
Estimated Equity
$2,255,446
Purchase Details
Closed on
Dec 3, 2003
Sold by
Wagner Joan H Mongetta
Bought by
Ando Wayne T and Snyder Ando Susan
Home Financials for this Owner
Home Financials are based on the most recent Mortgage that was taken out on this home.
Original Mortgage
$333,700
Outstanding Balance
$155,625
Interest Rate
5.86%
Mortgage Type
New Conventional
Estimated Equity
$2,255,446
Purchase Details
Closed on
Sep 2, 1997
Sold by
Mongetta Joan H
Bought by
Wagner Joan H Mongetta
Purchase Details
Closed on
Jul 20, 1994
Sold by
Maguire Allan F and Maguire Carole T
Bought by
Mongetta Joan H
Create a Home Valuation Report for This Property
The Home Valuation Report is an in-depth analysis detailing your home's value as well as a comparison with similar homes in the area
Home Values in the Area
Average Home Value in this Area
Purchase History
| Date | Buyer | Sale Price | Title Company |
|---|---|---|---|
| Ando Wayne T | -- | Chicago Title | |
| Ando Wayne T | $745,000 | Chicago Title | |
| Wagner Joan H Mongetta | -- | -- | |
| Mongetta Joan H | $316,000 | Old Republic Title Company |
Source: Public Records
Mortgage History
| Date | Status | Borrower | Loan Amount |
|---|---|---|---|
| Open | Ando Wayne T | $333,700 | |
| Open | Ando Wayne T | $596,000 |
Source: Public Records
Tax History Compared to Growth
Tax History
| Year | Tax Paid | Tax Assessment Tax Assessment Total Assessment is a certain percentage of the fair market value that is determined by local assessors to be the total taxable value of land and additions on the property. | Land | Improvement |
|---|---|---|---|---|
| 2025 | $15,447 | $1,182,105 | $639,796 | $542,309 |
| 2024 | $15,447 | $1,158,927 | $627,251 | $531,676 |
| 2023 | $15,149 | $1,136,203 | $614,952 | $521,251 |
| 2022 | $15,000 | $1,113,926 | $602,895 | $511,031 |
| 2021 | $14,674 | $1,092,085 | $591,074 | $501,011 |
| 2020 | $14,286 | $1,080,888 | $585,014 | $495,874 |
| 2019 | $13,958 | $1,059,695 | $573,544 | $486,151 |
| 2018 | $13,809 | $1,038,918 | $562,299 | $476,619 |
| 2017 | $13,067 | $966,246 | $551,274 | $414,972 |
| 2016 | $12,398 | $909,771 | $540,465 | $369,306 |
| 2015 | $12,140 | $881,331 | $532,347 | $348,984 |
| 2014 | $11,288 | $864,068 | $521,920 | $342,148 |
Source: Public Records
Map
Nearby Homes
- 6805 Almaden Rd
- 6605 Bret Harte Dr
- 6628 Wildwood Ct
- 6698 Charter Oak Place
- 6803 Lenwood Way
- 6579 Cooperage Ct
- 6565 Stonehill Dr
- 1122 Hearth Ct
- 1174 Old Oak Dr
- 1171 Wilhelmina Way
- 6421 Montana Ct
- 18950 Graystone Ln
- 6840 Hampton Dr
- 6384 Farm Hill Way
- 6898 Shearwater Dr
- 1101 Culligan Blvd
- 7025 Bret Harte Dr
- 6997 Elwood Rd
- 1238 Wooded Hills Dr
- 21287 Almaden Rd
- 1018 Akio Way
- 6654 Mount Pakron Dr
- 6658 Mount Pakron Dr
- 1016 Akio Way
- 6846 Trinidad Dr
- 6850 Trinidad Dr
- 6666 Mount Pakron Dr
- 6854 Trinidad Dr
- 6842 Trinidad Dr
- 1014 Akio Way
- 6858 Trinidad Dr
- 6838 Trinidad Dr
- 6672 Mount Pakron Dr
- 6653 Mount Pakron Dr
- 6862 Trinidad Dr
- 6650 Mount Holly Dr
- 1012 Akio Way
- 6646 Mount Holly Dr
- 6659 Mount Pakron Dr
- 6836 Trinidad Dr