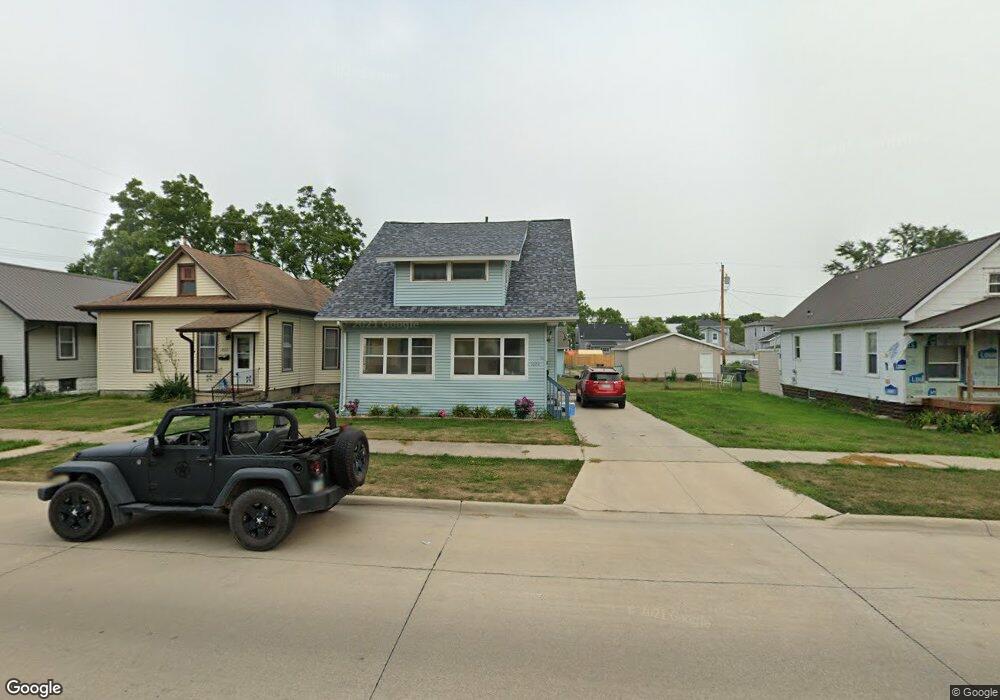
1020 B Ave NW Cedar Rapids, IA 52405
Northwest Area NeighborhoodEstimated Value: $130,000 - $147,000
3
Beds
1
Bath
1,109
Sq Ft
$125/Sq Ft
Est. Value
About This Home
This home is located at 1020 B Ave NW, Cedar Rapids, IA 52405 and is currently estimated at $138,762, approximately $125 per square foot. 1020 B Ave NW is a home located in Linn County with nearby schools including Junction City Elementary School, Harrison Elementary School, and Kentucky Tech - Ashland Reg Tech Center.
Ownership History
Date
Name
Owned For
Owner Type
Purchase Details
Closed on
Feb 21, 2011
Sold by
Black John M and Black J
Bought by
Black John M and Black Norma Jean
Current Estimated Value
Purchase Details
Closed on
Nov 19, 2003
Sold by
Covington Lyle J
Bought by
Black John M and Black J
Home Financials for this Owner
Home Financials are based on the most recent Mortgage that was taken out on this home.
Original Mortgage
$66,000
Outstanding Balance
$14,975
Interest Rate
6.25%
Mortgage Type
Unknown
Estimated Equity
$123,787
Purchase Details
Closed on
Jun 3, 2003
Sold by
Heskje James C
Bought by
Covington Lyle J
Home Financials for this Owner
Home Financials are based on the most recent Mortgage that was taken out on this home.
Original Mortgage
$77,000
Interest Rate
10%
Mortgage Type
Seller Take Back
Purchase Details
Closed on
Jun 2, 2003
Sold by
Smith Linda S and Heskje Linda S
Bought by
Heskje James C
Home Financials for this Owner
Home Financials are based on the most recent Mortgage that was taken out on this home.
Original Mortgage
$77,000
Interest Rate
10%
Mortgage Type
Seller Take Back
Create a Home Valuation Report for This Property
The Home Valuation Report is an in-depth analysis detailing your home's value as well as a comparison with similar homes in the area
Home Values in the Area
Average Home Value in this Area
Purchase History
| Date | Buyer | Sale Price | Title Company |
|---|---|---|---|
| Black John M | -- | None Available | |
| Black John M | $78,500 | -- | |
| Covington Lyle J | -- | -- | |
| Black John M | $79,000 | -- | |
| Heskje James C | -- | -- |
Source: Public Records
Mortgage History
| Date | Status | Borrower | Loan Amount |
|---|---|---|---|
| Open | Black John M | $66,000 | |
| Previous Owner | Black John M | $77,000 | |
| Closed | Black John M | $16,500 |
Source: Public Records
Tax History Compared to Growth
Tax History
| Year | Tax Paid | Tax Assessment Tax Assessment Total Assessment is a certain percentage of the fair market value that is determined by local assessors to be the total taxable value of land and additions on the property. | Land | Improvement |
|---|---|---|---|---|
| 2025 | $2,218 | $140,900 | $27,000 | $113,900 |
| 2024 | $2,250 | $133,000 | $25,000 | $108,000 |
| 2023 | $2,250 | $125,300 | $22,000 | $103,300 |
| 2022 | $2,026 | $106,700 | $22,000 | $84,700 |
| 2021 | $2,082 | $97,800 | $22,000 | $75,800 |
| 2020 | $2,082 | $94,400 | $16,000 | $78,400 |
| 2019 | $1,902 | $88,200 | $14,000 | $74,200 |
| 2018 | $1,776 | $88,200 | $14,000 | $74,200 |
| 2017 | $1,804 | $82,800 | $14,000 | $68,800 |
| 2016 | $1,760 | $82,800 | $14,000 | $68,800 |
| 2015 | $1,778 | $83,567 | $14,000 | $69,567 |
| 2014 | $1,778 | $83,567 | $14,000 | $69,567 |
| 2013 | $1,740 | $83,567 | $14,000 | $69,567 |
Source: Public Records
Map
Nearby Homes
- 217 11th St NW
- 1020 A Ave NW
- 1311 Burch Ave NW
- 1118 2nd Ave SW
- 720 E Ave NW
- 714 East Ave NW
- 1025 3rd Ave SW
- 819 G Ave NW
- 263 Highland Dr NW
- 716 F Ave NW
- 1073 G Ave NW
- 235 Highland Dr NW
- 810 3rd Ave SW
- 290 Highland Dr NW
- 816 9th St NW
- 1400 7th Ave SW
- 531 10th St SW
- 1016 H Ave NW
- 1649 B Ave NW
- 1602 1st Ave NW