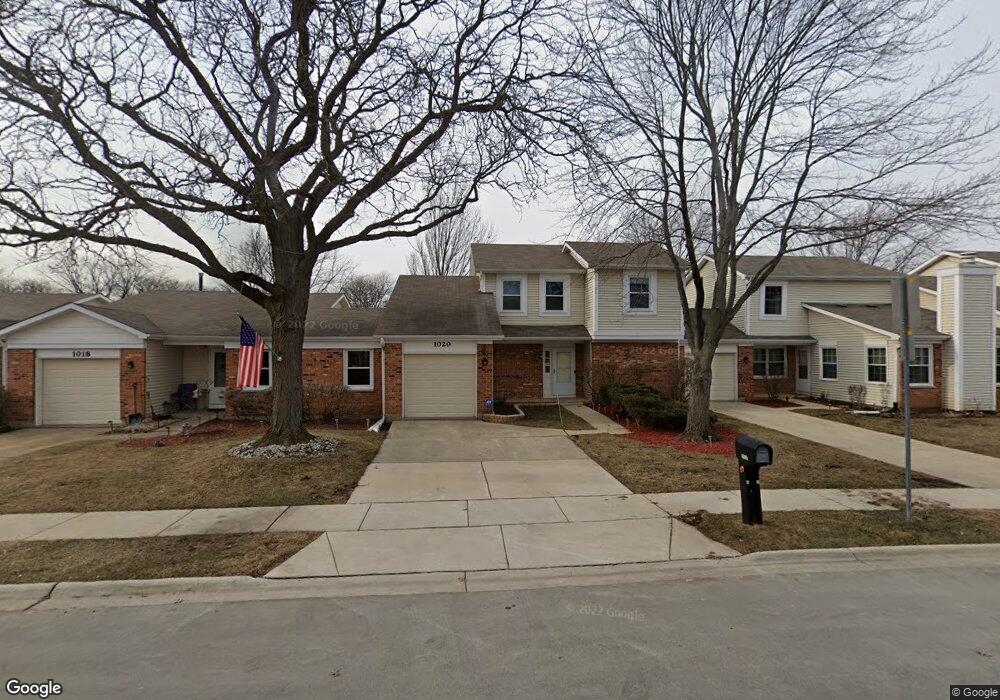
1020 Bayshore Dr Unit 1 Schaumburg, IL 60194
South Hoffman Estates NeighborhoodEstimated Value: $314,000 - $330,043
3
Beds
2
Baths
1,654
Sq Ft
$193/Sq Ft
Est. Value
About This Home
This home is located at 1020 Bayshore Dr Unit 1, Schaumburg, IL 60194 and is currently estimated at $320,011, approximately $193 per square foot. 1020 Bayshore Dr Unit 1 is a home located in Cook County with nearby schools including Hoover Math And Science Academy, Dwight D Eisenhower Junior High School, and Hoffman Estates High School.
Ownership History
Date
Name
Owned For
Owner Type
Purchase Details
Closed on
Sep 10, 2004
Sold by
Alberti Pamela A and Alberti Cynthia M
Bought by
Ariff Bilkis A
Current Estimated Value
Home Financials for this Owner
Home Financials are based on the most recent Mortgage that was taken out on this home.
Original Mortgage
$166,400
Outstanding Balance
$80,340
Interest Rate
5.5%
Mortgage Type
New Conventional
Estimated Equity
$239,671
Purchase Details
Closed on
Sep 1, 1999
Sold by
Cross Donald A and Cross Karen L
Bought by
Alberti Pamela A and Alberti Cynthia M
Purchase Details
Closed on
Apr 26, 1994
Sold by
Cross Donald A and Cross Karen L
Bought by
Cross Donald A and Cross Karen L
Home Financials for this Owner
Home Financials are based on the most recent Mortgage that was taken out on this home.
Original Mortgage
$66,000
Interest Rate
7.84%
Create a Home Valuation Report for This Property
The Home Valuation Report is an in-depth analysis detailing your home's value as well as a comparison with similar homes in the area
Home Values in the Area
Average Home Value in this Area
Purchase History
| Date | Buyer | Sale Price | Title Company |
|---|---|---|---|
| Ariff Bilkis A | $208,000 | Metropolitan Title Co | |
| Alberti Pamela A | $136,000 | -- | |
| Cross Donald A | -- | -- |
Source: Public Records
Mortgage History
| Date | Status | Borrower | Loan Amount |
|---|---|---|---|
| Open | Ariff Bilkis A | $166,400 | |
| Previous Owner | Cross Donald A | $66,000 |
Source: Public Records
Tax History Compared to Growth
Tax History
| Year | Tax Paid | Tax Assessment Tax Assessment Total Assessment is a certain percentage of the fair market value that is determined by local assessors to be the total taxable value of land and additions on the property. | Land | Improvement |
|---|---|---|---|---|
| 2024 | $6,075 | $25,000 | $3,500 | $21,500 |
| 2023 | $5,862 | $25,000 | $3,500 | $21,500 |
| 2022 | $5,862 | $25,000 | $3,500 | $21,500 |
| 2021 | $4,013 | $16,569 | $2,406 | $14,163 |
| 2020 | $4,011 | $16,569 | $2,406 | $14,163 |
| 2019 | $4,016 | $18,411 | $2,406 | $16,005 |
| 2018 | $4,559 | $18,625 | $2,085 | $16,540 |
| 2017 | $4,504 | $18,625 | $2,085 | $16,540 |
| 2016 | $4,819 | $19,944 | $2,085 | $17,859 |
| 2015 | $4,057 | $16,185 | $1,845 | $14,340 |
| 2014 | $4,029 | $16,185 | $1,845 | $14,340 |
| 2013 | $3,908 | $16,185 | $1,845 | $14,340 |
Source: Public Records
Map
Nearby Homes
- 1080 Colony Lake Dr
- 1085 Higgins Quarters Dr Unit 104
- 1075 Higgins Quarters Dr Unit 3-208
- 1025 Higgins Quarters Dr Unit 4-109
- 730 Hill Dr Unit 9205
- 720 Hill Dr Unit 8303
- 1080 Knoll Ln Unit 305
- 600 Mesa Dr Unit 103
- 600 Mesa Dr Unit 104
- 615 Hill Dr Unit 303
- 1195 Meadow Ln Unit 213
- 1195 Meadow Ln Unit 114
- 1074 Wilmington Ln
- 1105 Wilmington Ln
- 1327 Churchill Rd
- 368 Cedar Tree Ct
- 1440 Dennison Rd
- 363 Oaktree Ct
- 365 Juniper Tree Ct
- 989 Butter Creek Ct Unit 3NE
- 1016 Bayshore Dr
- 1018 Bayshore Dr
- 1022 Bayshore Dr Unit 1
- 1024 Bayshore Dr
- 1007 Bayshore Dr
- 1042 N Salem Dr
- 1006 Bayshore Dr
- 1006 Bayshore Dr Unit A
- 1001 Bayshore Dr
- 1044 N Salem Dr Unit 1
- 1004 Bayshore Dr
- 1101 Colony Lake Dr
- 1005 Bayshore Dr
- 1099 Colony Lake Dr
- 1000 Bayshore Dr
- 1002 Bayshore Dr
- 1003 Bayshore Dr
- 1046 N Salem Dr Unit 1
- 1097 Colony Lake Dr
- 1097 Colony Lake Dr Unit 1