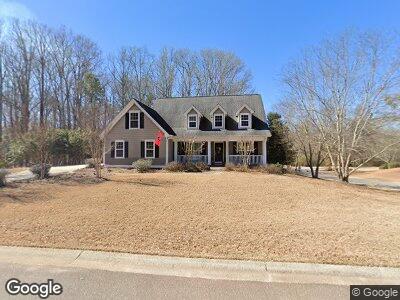
1020 Christian Ln Watkinsville, GA 30677
Estimated Value: $474,491 - $568,000
--
Bed
--
Bath
1,764
Sq Ft
$302/Sq Ft
Est. Value
About This Home
This home is located at 1020 Christian Ln, Watkinsville, GA 30677 and is currently estimated at $531,873, approximately $301 per square foot. 1020 Christian Ln is a home located in Oconee County with nearby schools including Colham Ferry Elementary School, Oconee County Middle School, and Oconee County High School.
Ownership History
Date
Name
Owned For
Owner Type
Purchase Details
Closed on
Aug 12, 2005
Sold by
Lane & Lane Builders Inc
Bought by
Baer Kevin T and Baer Melanie C
Current Estimated Value
Home Financials for this Owner
Home Financials are based on the most recent Mortgage that was taken out on this home.
Original Mortgage
$197,500
Interest Rate
5.61%
Mortgage Type
New Conventional
Purchase Details
Closed on
Apr 25, 2005
Sold by
Dbh
Bought by
Lane & Lane Builders Inc
Home Financials for this Owner
Home Financials are based on the most recent Mortgage that was taken out on this home.
Original Mortgage
$186,000
Interest Rate
5.99%
Mortgage Type
New Conventional
Purchase Details
Closed on
Apr 20, 2005
Sold by
Dbh Llc
Bought by
Lane & Lane Builders Inc
Home Financials for this Owner
Home Financials are based on the most recent Mortgage that was taken out on this home.
Original Mortgage
$186,000
Interest Rate
5.99%
Mortgage Type
New Conventional
Create a Home Valuation Report for This Property
The Home Valuation Report is an in-depth analysis detailing your home's value as well as a comparison with similar homes in the area
Home Values in the Area
Average Home Value in this Area
Purchase History
| Date | Buyer | Sale Price | Title Company |
|---|---|---|---|
| Baer Kevin T | $246,910 | -- | |
| Lane & Lane Builders Inc | $115,000 | -- |
Source: Public Records
Mortgage History
| Date | Status | Borrower | Loan Amount |
|---|---|---|---|
| Open | Baer Kevin T | $224,867 | |
| Closed | Baer Kevin T | $197,500 | |
| Closed | Baer Kevin T | $49,400 | |
| Previous Owner | Lane & Lane Builders Inc | $186,000 | |
| Previous Owner | Lane & Lane Builders Inc | $186,000 |
Source: Public Records
Tax History Compared to Growth
Tax History
| Year | Tax Paid | Tax Assessment Tax Assessment Total Assessment is a certain percentage of the fair market value that is determined by local assessors to be the total taxable value of land and additions on the property. | Land | Improvement |
|---|---|---|---|---|
| 2024 | $3,968 | $179,028 | $33,000 | $146,028 |
| 2023 | $3,968 | $171,872 | $33,000 | $138,872 |
| 2022 | $3,722 | $154,464 | $33,000 | $121,464 |
| 2021 | $3,454 | $133,836 | $24,200 | $109,636 |
| 2020 | $3,100 | $118,862 | $22,000 | $96,862 |
| 2019 | $2,893 | $110,415 | $22,000 | $88,415 |
| 2018 | $2,761 | $103,513 | $22,000 | $81,513 |
| 2017 | $2,564 | $95,598 | $22,000 | $73,598 |
| 2016 | $2,565 | $95,239 | $22,000 | $73,239 |
| 2015 | $2,558 | $94,648 | $22,000 | $72,648 |
| 2014 | $2,450 | $88,741 | $22,000 | $66,741 |
| 2013 | -- | $86,083 | $22,000 | $64,083 |
Source: Public Records
Map
Nearby Homes
- 1200 Paxton Ct
- 1810 Paxton Ct
- 1511 Paxton Ct
- 1036 Falling Leaf Ct Unit 2
- 1045 Falling Leaf Ct Unit 6
- 1330 Christian Dr
- 125 Hight Dr
- 85 Cedar Dr
- 30 Harden Hill Rd
- 88 Cedar Dr
- 17 Harden Hill Rd Unit 103
- 194 New High Shoals Rd
- 196 New High Shoals Rd
- 159 S Main St
- 170 New High Shoals Rd
- 1040 Woodberry Dr
- 0 Colham Ferry Rd Unit LOT 5 10260362
- 0 Colham Ferry Rd Unit LOT 4 10260358
- 0 Colham Ferry Rd Unit LOT 3 10260353
- 1020 Christian Ln
- 130 Briers Ridge
- 1111 Felton Dr
- 1130 Felton Dr
- 1120 Felton Dr
- 1030 Christian Ln
- 0 Christian Ln Unit 7358068
- 0 Christian Ln Unit 7084426
- 0 Christian Ln Unit 8765601
- 0 Christian Ln Unit 7608235
- 0 Christian Ln Unit 7449400
- 0 Christian Ln
- 1141 Felton Dr Unit 44 B
- 1141 Felton Dr
- 1101 Felton Dr
- 1031 Christian Ln
- 1100 Felton Dr
- 1161 Christian Terrace
- 1180 Christian Terrace
- 1050 Christian Ln