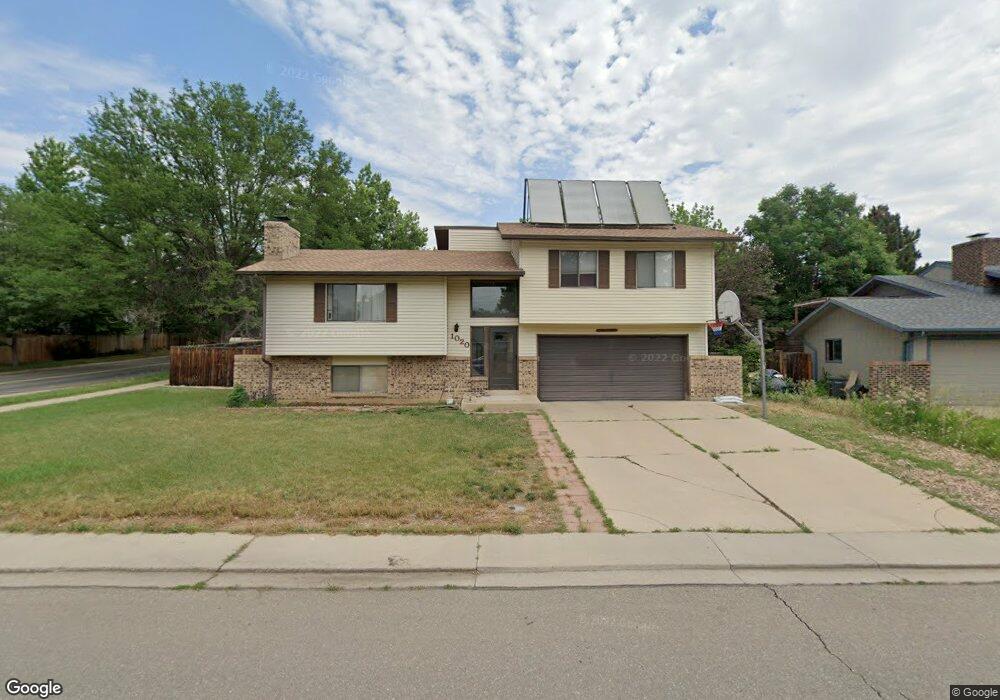
1020 Delphi Dr Lafayette, CO 80026
Estimated Value: $626,315 - $738,000
3
Beds
4
Baths
1,180
Sq Ft
$577/Sq Ft
Est. Value
About This Home
This home is located at 1020 Delphi Dr, Lafayette, CO 80026 and is currently estimated at $680,829, approximately $576 per square foot. 1020 Delphi Dr is a home located in Boulder County with nearby schools including Lafayette Elementary School, Angevine Middle School, and Centaurus High School.
Ownership History
Date
Name
Owned For
Owner Type
Purchase Details
Closed on
Jun 11, 2020
Sold by
Blazon E Leroy
Bought by
Blazon E Leroy E and Blazon Margaret J
Current Estimated Value
Home Financials for this Owner
Home Financials are based on the most recent Mortgage that was taken out on this home.
Original Mortgage
$703,500
Outstanding Balance
$688,010
Interest Rate
2.88%
Mortgage Type
Reverse Mortgage Home Equity Conversion Mortgage
Estimated Equity
-$7,181
Purchase Details
Closed on
Mar 31, 2005
Sold by
Blazon E Leroy and Blazon Margaret J
Bought by
Blazon E Leroy
Purchase Details
Closed on
Sep 8, 1978
Bought by
Blazon E Leroy
Purchase Details
Closed on
Mar 29, 1978
Bought by
Blazon E Leroy
Create a Home Valuation Report for This Property
The Home Valuation Report is an in-depth analysis detailing your home's value as well as a comparison with similar homes in the area
Home Values in the Area
Average Home Value in this Area
Purchase History
| Date | Buyer | Sale Price | Title Company |
|---|---|---|---|
| Blazon E Leroy E | -- | None Available | |
| Blazon E Leroy | -- | -- | |
| Blazon E Leroy | $55,000 | -- | |
| Blazon E Leroy | -- | -- |
Source: Public Records
Mortgage History
| Date | Status | Borrower | Loan Amount |
|---|---|---|---|
| Open | Blazon E Leroy E | $703,500 |
Source: Public Records
Tax History
| Year | Tax Paid | Tax Assessment Tax Assessment Total Assessment is a certain percentage of the fair market value that is determined by local assessors to be the total taxable value of land and additions on the property. | Land | Improvement |
|---|---|---|---|---|
| 2025 | $2,764 | $37,407 | $17,944 | $19,463 |
| 2024 | $2,764 | $37,407 | $17,944 | $19,463 |
| 2023 | $2,716 | $37,889 | $17,949 | $23,624 |
| 2022 | $2,145 | $29,788 | $14,011 | $15,777 |
| 2021 | $2,122 | $30,645 | $14,414 | $16,231 |
| 2020 | $2,054 | $29,622 | $11,583 | $18,039 |
| 2019 | $2,025 | $29,622 | $11,583 | $18,039 |
| 2018 | $1,704 | $25,870 | $11,088 | $14,782 |
| 2017 | $1,659 | $28,600 | $12,258 | $16,342 |
| 2016 | $1,296 | $22,073 | $8,915 | $13,158 |
| 2015 | $1,214 | $18,372 | $4,856 | $13,516 |
| 2014 | $900 | $18,372 | $4,856 | $13,516 |
Source: Public Records
Map
Nearby Homes
- 736 Julian Cir
- 718 Julian Cir
- 1287 Doric Dr
- 365 Vernier Ave
- 1140 Devonshire Ct
- 167 Salina St
- 876 Cimarron Dr Unit B
- 920 Milo Cir Unit A
- 924 Milo Cir Unit A
- 1045 Milo Cir Unit A
- 1091 Milo Cir Unit B
- 1053 Delta Dr Unit B
- 421 S Dover Ave
- 1998 Foxtail Ln Unit B
- 1048 Milo Cir Unit A
- 1031 Delta Dr
- 372 S Carr Ave
- 1198 Milo Cir Unit A
- 1150 Bacchus Dr Unit 19-A
- 1080 Artemis Cir
Your Personal Tour Guide
Ask me questions while you tour the home.