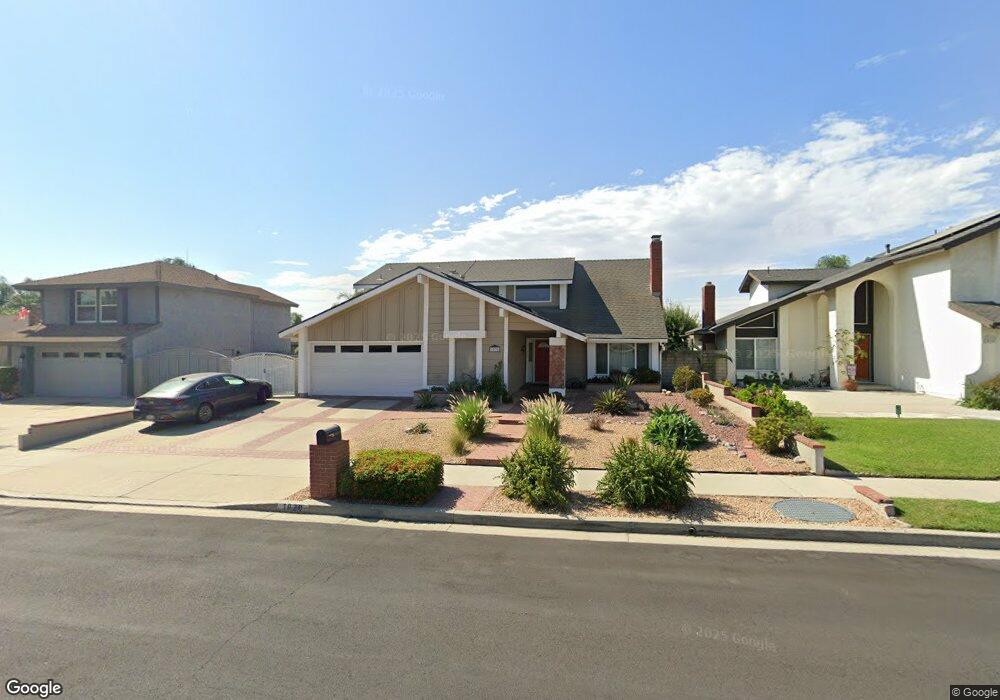
1020 E Saint Andrews St Ontario, CA 91761
Ontario Ranch NeighborhoodEstimated Value: $762,000 - $851,000
4
Beds
3
Baths
1,969
Sq Ft
$403/Sq Ft
Est. Value
About This Home
This home is located at 1020 E Saint Andrews St, Ontario, CA 91761 and is currently estimated at $793,079, approximately $402 per square foot. 1020 E Saint Andrews St is a home located in San Bernardino County with nearby schools including Liberty Elementary School, Woodcrest Junior High, and Chino High School.
Ownership History
Date
Name
Owned For
Owner Type
Purchase Details
Closed on
Oct 16, 2001
Sold by
Garibay Jesus
Bought by
Garibay Jesus and Garibay Beatriz
Current Estimated Value
Home Financials for this Owner
Home Financials are based on the most recent Mortgage that was taken out on this home.
Original Mortgage
$148,650
Outstanding Balance
$58,102
Interest Rate
6.87%
Estimated Equity
$734,977
Purchase Details
Closed on
Jul 27, 1995
Sold by
Federal Home Loan Mortgage Corporation
Bought by
Garibay Jesus
Home Financials for this Owner
Home Financials are based on the most recent Mortgage that was taken out on this home.
Original Mortgage
$150,307
Interest Rate
7.63%
Mortgage Type
FHA
Purchase Details
Closed on
Mar 28, 1995
Sold by
Walker Richard L and Walker Miriam M
Bought by
Federal Home Loan Mortgage Corporation
Purchase Details
Closed on
Feb 21, 1995
Sold by
Walker Miriam M
Bought by
Walker Richard L
Create a Home Valuation Report for This Property
The Home Valuation Report is an in-depth analysis detailing your home's value as well as a comparison with similar homes in the area
Home Values in the Area
Average Home Value in this Area
Purchase History
| Date | Buyer | Sale Price | Title Company |
|---|---|---|---|
| Garibay Jesus | -- | First American Title | |
| Garibay Jesus | $153,636 | American Title Ins Co | |
| Federal Home Loan Mortgage Corporation | $145,000 | Stewart Title | |
| Walker Richard L | -- | -- |
Source: Public Records
Mortgage History
| Date | Status | Borrower | Loan Amount |
|---|---|---|---|
| Open | Garibay Jesus | $148,650 | |
| Closed | Garibay Jesus | $150,307 |
Source: Public Records
Tax History Compared to Growth
Tax History
| Year | Tax Paid | Tax Assessment Tax Assessment Total Assessment is a certain percentage of the fair market value that is determined by local assessors to be the total taxable value of land and additions on the property. | Land | Improvement |
|---|---|---|---|---|
| 2025 | $2,822 | $254,812 | $49,837 | $204,975 |
| 2024 | $2,822 | $249,816 | $48,860 | $200,956 |
| 2023 | $2,746 | $244,918 | $47,902 | $197,016 |
| 2022 | $2,730 | $240,116 | $46,963 | $193,153 |
| 2021 | $2,677 | $235,408 | $46,042 | $189,366 |
| 2020 | $2,643 | $232,994 | $45,570 | $187,424 |
| 2019 | $2,598 | $228,425 | $44,676 | $183,749 |
| 2018 | $2,542 | $223,946 | $43,800 | $180,146 |
| 2017 | $2,497 | $219,555 | $42,941 | $176,614 |
| 2016 | $2,337 | $215,250 | $42,099 | $173,151 |
| 2015 | $2,292 | $212,017 | $41,467 | $170,550 |
| 2014 | $2,248 | $207,864 | $40,655 | $167,209 |
Source: Public Records
Map
Nearby Homes
- 1020 E Tam o Shanter Ct
- 2708 S Parkside Dr
- 2919 S Caldwell Ave
- 2437 S Garfield Place
- 2453 S Marigold Place
- 2408 S Taylor Place
- 4235 S Gasly Paseo
- 0 Vineyard Unit CV25067044
- 4245 S Grasly Paseo
- 4233 S Grasly Paseo
- 0 Phillips Unit CV23180894
- 2718 S Sandpiper Ave
- 2413 S Parco Ave
- 2535 S Imperial Place
- 2817 S Lassen Ave
- 513 E Fairfield Ct
- 2424 S Lake Ave
- 2300 S Sultana Ave Unit 298
- 2119 S Phoenix Place
- 1456 E Philadelphia St Unit 134
- 1014 E Saint Andrews St
- 1026 E Saint Andrews St
- 1055 E Deerfield St
- 1047 E Deerfield St
- 1008 E Saint Andrews St
- 1032 E Saint Andrews St
- 1039 E Deerfield St
- 1063 E Deerfield St
- 1019 E Saint Andrews St
- 1013 E Saint Andrews St
- 1002 E Saint Andrews St
- 1038 E Saint Andrews St
- 1031 E Deerfield St
- 1007 E Saint Andrews St
- 1071 E Deerfield St
- 2739 S Holmes Ave
- 957 E Saint Andrews St
- 1023 E Deerfield St
- 950 E Saint Andrews St
- 1044 E Saint Andrews St