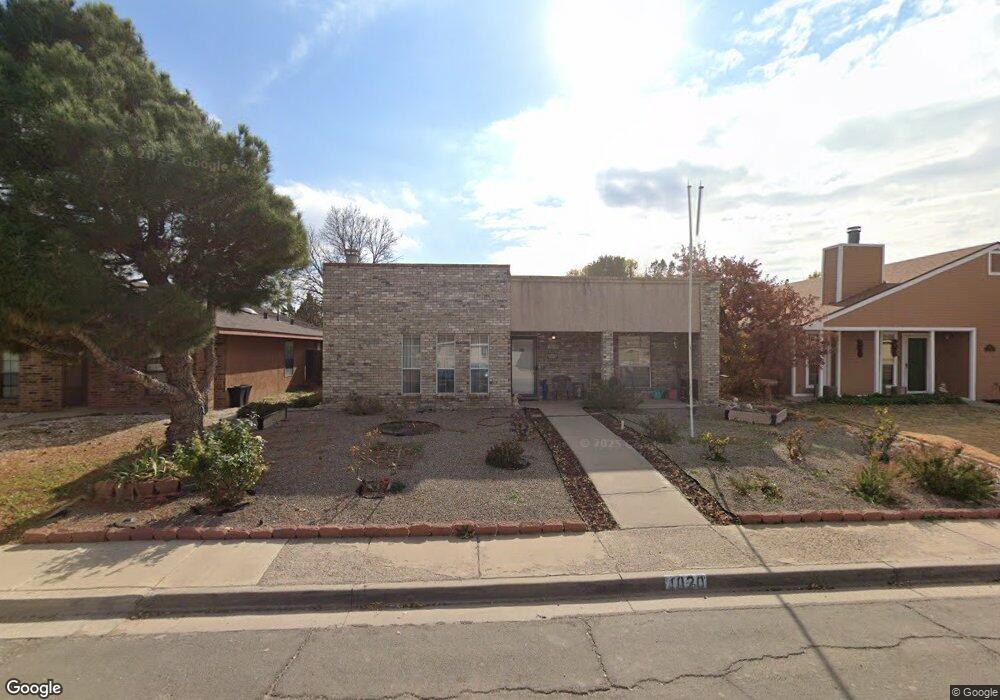
1020 Fern Dr Roswell, NM 88203
Estimated Value: $214,000 - $229,000
2
Beds
2
Baths
1,530
Sq Ft
$145/Sq Ft
Est. Value
About This Home
This home is located at 1020 Fern Dr, Roswell, NM 88203 and is currently estimated at $221,387, approximately $144 per square foot. 1020 Fern Dr is a home located in Chaves County with nearby schools including Valley View Elementary School, Sierra Middle School, and Roswell High School.
Ownership History
Date
Name
Owned For
Owner Type
Purchase Details
Closed on
Feb 28, 2023
Sold by
Steed Janet Sue
Bought by
Fleming Joe and Fleming Elizabeth
Current Estimated Value
Home Financials for this Owner
Home Financials are based on the most recent Mortgage that was taken out on this home.
Original Mortgage
$115,500
Outstanding Balance
$112,002
Interest Rate
6.33%
Mortgage Type
New Conventional
Estimated Equity
$109,385
Purchase Details
Closed on
Oct 14, 2022
Sold by
Barton Larry Eugene
Bought by
Steed Janet Sue
Purchase Details
Closed on
Nov 18, 2021
Sold by
Sun Country Rlty Insun Country Rlty Inc
Bought by
Barton Larry Eugene
Home Financials for this Owner
Home Financials are based on the most recent Mortgage that was taken out on this home.
Original Mortgage
$157,472
Interest Rate
2.99%
Mortgage Type
VA
Create a Home Valuation Report for This Property
The Home Valuation Report is an in-depth analysis detailing your home's value as well as a comparison with similar homes in the area
Home Values in the Area
Average Home Value in this Area
Purchase History
| Date | Buyer | Sale Price | Title Company |
|---|---|---|---|
| Fleming Joe | -- | Fidelity National Title | |
| Steed Janet Sue | -- | -- | |
| Barton Larry Eugene | -- | Landmark Title Company |
Source: Public Records
Mortgage History
| Date | Status | Borrower | Loan Amount |
|---|---|---|---|
| Open | Fleming Joe | $115,500 | |
| Previous Owner | Barton Larry Eugene | $157,472 |
Source: Public Records
Tax History Compared to Growth
Tax History
| Year | Tax Paid | Tax Assessment Tax Assessment Total Assessment is a certain percentage of the fair market value that is determined by local assessors to be the total taxable value of land and additions on the property. | Land | Improvement |
|---|---|---|---|---|
| 2025 | $2,046 | $74,411 | $3,333 | $71,078 |
| 2024 | $2,046 | $75,257 | $3,333 | $71,924 |
| 2023 | $1,536 | $54,698 | $3,333 | $51,365 |
| 2022 | $1,482 | $53,308 | $3,333 | $49,975 |
| 2021 | $1,169 | $41,137 | $3,333 | $37,804 |
| 2020 | $1,135 | $39,939 | $3,333 | $36,606 |
| 2019 | $1,101 | $38,776 | $3,333 | $35,443 |
| 2018 | $1,067 | $37,647 | $3,333 | $34,314 |
| 2017 | $1,026 | $36,551 | $3,333 | $33,218 |
| 2016 | $986 | $35,486 | $3,333 | $32,153 |
| 2015 | $1,054 | $34,453 | $3,333 | $31,120 |
| 2014 | $2,046 | $33,450 | $3,333 | $30,117 |
Source: Public Records
Map
Nearby Homes
- 1000 Fern Dr
- 1009 Ivy Dr
- 1034 Ivy Dr
- 1028 Clover Ln
- 1012 S Plains Park Dr
- 305 S Sunset Ave
- 0 S Union Ave
- 000 S Union Ave
- 1907 S Washington Ave
- 1006 W Hobbs St
- 503 W Hervey Dr
- 705 N Plains Park Dr
- 1202 Baylor Dr
- 1002 Plaza Del Sol
- 609 W Gayle St
- 704 W Gayle St
- 600 Barnett Dr
- 000 S Washington Ave
- 1505 Taylor Dr
- 2706 W Onyx St